What Can You Learn From Visitor Analysis For Your Events?

It’s natural to wonder what’s holding back an event from being even more engaging. Traditional live event metrics give us the numbers but visitor analysis goes deeper in order to tell us the human story behind them. It reveals not just where people go but helps us figure out why they go there.
Gone are the days of relying on gut feelings and guesswork. Modern tracking technology helps us understand how people actually experience your event – what draws them in, what makes them stay, and what might be holding them back.
Let’s look at what we can learn.
Get to Know the Top Visitor Analysis Metrics
There are several key metrics that visitor analysis can reveal. By using tracking technology you’ll be able to get a better understanding of how your visitors interact with your exhibition or live event. Let’s get to know them.
1. Movement Patterns and Flow
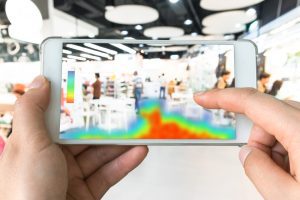
We all know how frustrating it is to get caught in a bottleneck at an event. By tracking how people naturally move through your space, you can spot these problems before they happen. Heat mapping shows us the whole picture – from the busiest pathways to the quieter corners waiting to be improved.
Example: A catering stand might work better positioned near a naturally quiet area than adding to congestion in an already busy area. Heat maps help us spot these opportunities.
How can you improve visitor flows?
In terms of practical steps, you might want to consider positioning your most popular attractions strategically to help spread foot traffic evenly. Ultimately you’ll need to monitor footfall and flow routes, such as with tracking technology like our EX Sensors.
2. Engagement Levels
There’s a big difference between someone walking past your stand and actually stopping to engage. It’s a bit like having a shop on a busy high street – lots of window shoppers doesn’t always mean lots of customers. That’s why we look beyond footfall to understand genuine engagement in order to measure your event success.
Example: Our sensors might reveal that a product demonstration in a quieter spot holds people’s attention for five minutes, while the same demo in a busy thoroughfare barely gets a glance.
How can you improve attendee engagement?
Give your attendees something that stops them in their tracks. In the world of events, more and more brands are investing in experiential marketing activations. Take a look at how the pros are doing it with these experiential marketing examples from market leaders that might spark some inspiration for your next event.
3. Space Utilisation
Every bit of event space costs money – so it needs to earn its keep. We look at how people actually use your space, not just where they go. Sometimes the smallest changes can make the biggest difference to how people interact with your event.
Example: By tracking dwell time, we might spot that visitors spend twice as long at exhibits with seating nearby – a simple insight that could change the engagement across your whole space.
How can you improve your venue space utilisation?
There are plenty of ways to ensure your entire venue space is working harder for you. Ensure you optimise venue space by using everything in your arsenal, from sustainable practices to tracking
4. Time-Based Patterns
Events have their own natural rhythm. Often they’re peppered with busy periods and lulls, but these aren’t always when you’d expect them. Understanding these patterns means you can have the right people in the right places at the right time.
Example: Visitor analysis could show your space is actually busiest between 2-4 pm, not during the morning rush everyone expects. This could change your staff rota, meaning you’re better covered for peak times and not over-staffed during quieter times.
How can you use timing to your advantage?
By understanding when visitors are most likely to be at your event, you can make sure you have enough staff to cover your event, but that you’re capitalising on when the most people will see what you have planned. This means you can plan product demonstrations and brand activations at the best time possible.
Visitor Analysis in Action at the Made in America Festival
At Philadelphia’s Made in America Festival, Exposure Analytics deployed sensors across the public areas to measure movement, hotspots and engagement in key areas. Our technology revealed data driven insights that challenged traditional assumptions about space usage.
The heat mapping showed the merchandising area, despite being located by the main entrance, wasn’t popular on either day of the festival. Meanwhile, when comparing footfall and engagement rates, one food stall saw less overall traffic but achieved a much higher conversion rate of visitors who stopped.
This data proved particularly valuable as it could be broken down into detailed time intervals, allowing organisers to analyse patterns across both days of the festival and plan future improvements accordingly.
Read the rest of the case study for deeper insights.
See Your Event With New Eyes
Ready to discover what visitor analysis could reveal about your event? Our technology has analysed over 5,000 events worldwide, each time uncovering insights that transformed how organisers understood their space.
Here’s exactly how we can help you understand your visitors:
EX Sensors – Captures footfall, dwell times and engagement rates using WiFi signals to reveal how people interact with your space.
Apex Monitor – Counts visitors and monitors occupancy levels to help you manage capacity and peak times effectively.
Get in touch to discuss how visitor analysis could help you make the most of your future events. With event analytics at your disposal, you can get an insider’s view on what’s working for your visitors and what needs improvement to be more engaging.


