Made in America Festival
At Made in America in Philadelphia, Exposure Analytics deployed sensors across the public areas to measure movement, hotspots and engagement…
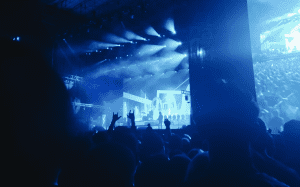
A Tale of Two Sponsors at Lollapalooza
Sponsors are a crucial part of the financial success of festivals. In return they want a good return on their…
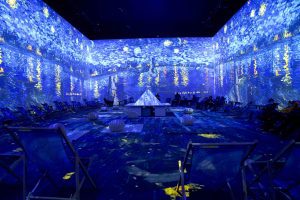
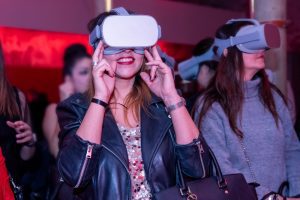
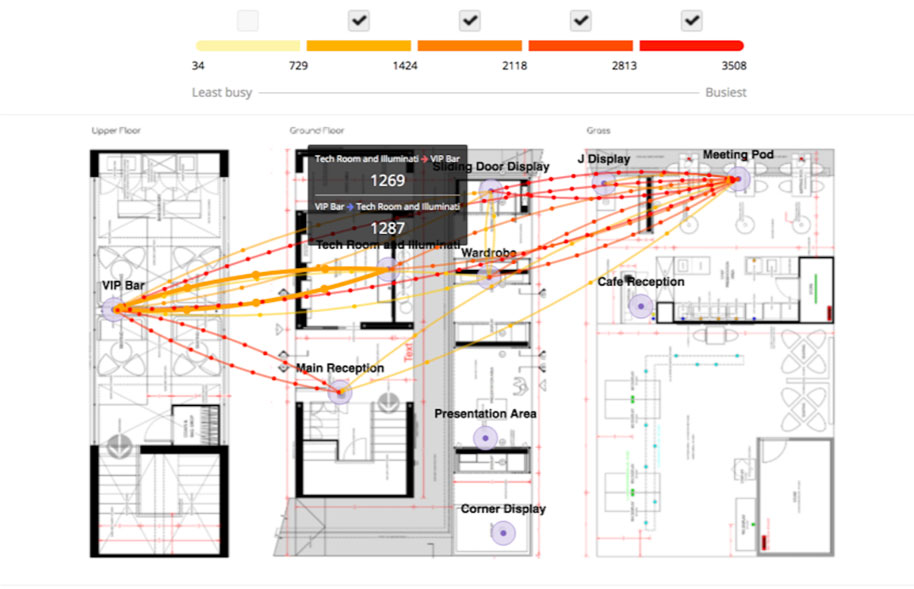
Evaluating an Immersive Experience
Our client, a major household name, was exhibiting at the most important event in their annual calendar. They appointed a…
Production Bureau
Production Bureau supported their client, a leading technology company, with the delivery of a bespoke exhibition stand for the…
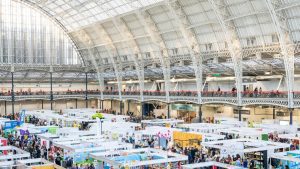
Event Tech Live
The Challenge Running a successful trade show takes a huge amount of time, effort and budget. During the event, organisers…
Hafele
Hafele, a furniture fittings company used Exposure Analytics to assess their attendance at the 2018 Kitchen and Bathroom Show. Like…
Olympia eForce
The Challenge Exhibiting companies and exhibition organisers are often demanding clients. With tightened marketing budgets, businesses are looking harder than…
Exposure Analytics at Event Tech Live
The Challenge We attend Event Tech Live annually; it’s the only trade show we take a stand at. We’re keen…

Shelton Fleming
They produce summits, forums, roadshows, exhibition booths, customer centres, product showcases and brand activations along with film and digital content.…