Telling Your Stories Through Data

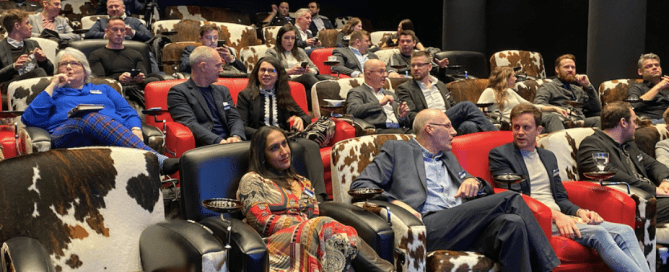
Graham Smith of Shelton Fleming joined us as one of the guest speakers at our recent Data and Dining event to share some useful insight about using data to tell your story. Shelton Fleming use Exposure Analytics sensors and the data they collect to help evaluate the thought-provoking experiences they create for their clients.
One of Graham’s key points was the insight comes from data and context; and it’s only when you put those two things together that you can tell your story. Here’s what else he shared with us:
Bias and Correlation
When we’re looking at data, it is really important to avoid bias. We need to avoid thinking the data is showing what we want it to show and trying to nudge towards a favourable interpretation. This does clients a disservice. One tip Graham gave was to try to prove yourself wrong if you are worried about how you are interpreting the data.
We also need to be careful that we don’t confuse correlation with causation. Graham gave us a great example of a correlation that isn’t necessarily causation with this graph of drowning incidents and ice cream consumption

The data shows a clear correlation between raised ice cream consumption and drowning. Why?
Are we literally drowning in ice cream?
Do grieving relatives eat more ice cream?
Were our mums right to say that swimming on a full stomach is dangerous?
Or is there a missing link – some context that we need? In this case, it is summer. Ice cream and drowning both increase at the same time of year because of the nice weather, but that doesn’t mean that one is caused by the other.
It’s the same with your events. Data context is vital to being able to interpret it correctly and tell your story.
Big Data v Small Data
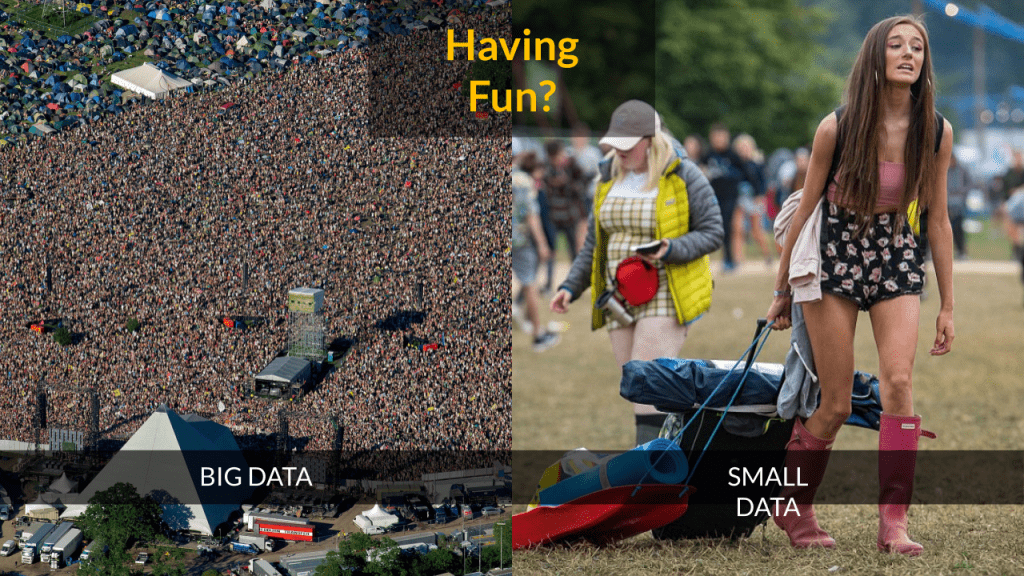
Big data has been talked about for a long time as something that is going to change the world. Actually, it’s not necessarily the most important thing – especially when you are analysing events. Graham explained that it’s difficult to make decisions based on big data. It works well if you have a hypothesis but actually it’s “small data that you can make impactful changes with” Data needs to be small enough for human comprehension and in an intuitive format so that we can understand it.
Graham showed us these two images as an example and asked us if we can tell whether people are having fun

Here at Exposure Analytics we have a huge dataset, with more than 5 billion lines of data to crunch into small datasets that are really easy to work with. But, as Graham explained, the numbers are only half of the story. The advantage of us being at an event is that we can add context , wrap it around the data and tell the full story.
For each event that they are involved with, Shelton Fleming produces a report that importantly combines both key metrics and analysis notes. For example it could help explain that high traffic figures are due to your impact or whether its due to a particularly successful competitor nearby.. Good use of data and applying context will help you to work out if you’re spending your money wisely and helps both evaluation and future planning.
So how do you make better use of the data?
Graham strongly recommends having a data storyteller – someone who works across multiple events and teams and can recognise that data is a journey and not a single point.
He also reminded us that there’s no such thing as bad numbers. There’s definitely disappointing numbers – but they will either teach you that your methods weren’t the best or that you need to change something. It may be to make the stand more exciting or to adapt the pre-event marketing. Without those numbers you’ll never know.
“Having sensors at each event turns the story from a series of one-off novellas into a ‘choose your own adventure’ series – your work is a continuation of previous work and you get to make the next choice. When you have data, even inaction is a choice, you can choose to do the same thing again”
In summary
1 Real insight is achieved by using data and context together
2 The right tool for the job is crucial, you can’t tell the right story if you were using the wrong data
3 Never see data as a judgement
4 Embrace your data
Are you going to use data to tell your story?
Look out for more details of other presentations from the Data And Dining event coming soon. For more information about what data we can collect for you and how you can use it please get in touch.


