Read Article

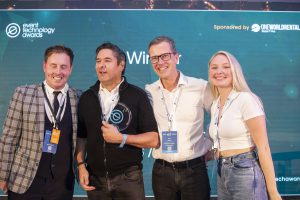
We’re so proud to be able to say that we were successful at the Event Technology Awards for the fourth year in a row! Once again our event analytics technology was judged to be ‘Best use of Technology for Event Analytics / Data Collection’
Despite the pandemic we’ve had our sensors in action at a series of events this year. Our award entries highlight the diverse range of events and activations that use our technology.
A major car manufacturer were launching their latest model. They had put a huge amount of time and effort into a cutting edge 3D activation in central London. But, post-pandemic, they needed to know whether there was passing traffic in that area, would people stop to watch, and crucially would they spend in the perfect spot to get the best out of the activation? In a busy city-centre environment we helped our client accurately assess the footfall and what percentage of passing traffic converted into engagement – which turned out to be an incredibly impressive 77%. Without our data, they would not have been able to measure the return on their marketing investment as accurately and confirm the success of their activation.
We’ve also been working with a high-profile outdoor venue in London. They wanted to measure footfall during the post-pandemic period. Without wireless technology in place, it would be much harder to get a true sense of behaviour on site, or would require staff to try to monitor visitor numbers and movements. This would be time consuming and potentially very expensive over a period of months. One particular aspect they were keen to measure was footfall and dwell times for concessions at the attraction.
The data transmitted included details of overall visitor numbers and dwell times at ten locations. Day by day analysis of the figures shows weather information to help with accurate evaluation of fluctuations in visitor numbers. In addition each sensor location can be compared to see which areas are most and least popular and how long people are spending there.
All of this data is hugely valuable to our clients so they have a really accurate picture of how people are behaving, whether they need to adapt anything based on the data, and also whether behaviour is changing over time. They are so pleased with the performance they are installing our technology at another of their venues.
We also returned to a large scale festival where we supported several car manufacturers to analyse the success of their stands. For many exhibitors it was their first major event for over a year. They wanted to know whether Covid worries would affect visitor numbers and impact their return on marketing investment. They also wanted to check whether official attendance figures from the organisers were accurate. Having previously covered the same event, we were able to compare this year’s data with historic analytics. We were able to give exhibitors the insight they needed into visitor engagement, dwell times and attendance. This allowed them to see if visitors numbers were up, down, or similar to previous years. For each of our clients we also provide detailed analytics of their stand or activation, showing heat maps and flow routes around their area They can compare and contrast which cars or attractions were most popular. The the data is broken down into five minute intervals so it is easy to see the impact of any changes to what is on the stand or efforts to draw people in at a particular time.
Although we picked up a prize at last year’s virtual award ceremony, it wasn’t quite the same as the usual fun-filled event. This year, it was amazing to be back in a room with the other nominees. Well done to all of the Event Technology Awards winners. We’ll be back next year hoping to make it five years in a row!