The vital data automotive marketing managers miss

Marketing budgets aren’t limitless and calculating return on investment is a key part of any marketing strategy. We’re all used to great digital analytics when we run online campaigns, but what about physical events. In the past there has been a real gap in accurate reporting figures for motor shows, activations and event sponsorship. Despite the millions of pounds spent by automotive brands on these activities each year, much of the evaluation has relied on anecdotal feedback.
We’re now working with many of the major car companies, and the list is growing all the time. We help them to evaluate their off-line marketing activities. One of the main reasons they use us is the quality of the data and the valuable insights we can provide them with.
Stop Guessing – Start Measuring
Exposure Analytics from Forge SP offers digital analytics for physical events. A consistent reliable way to measure your experiential activity.
We can help you to understand how many people visit your exhibition stands or activations, how many are tempted to engage with the stand’s features and which parts of the exhibition or activities they like best.
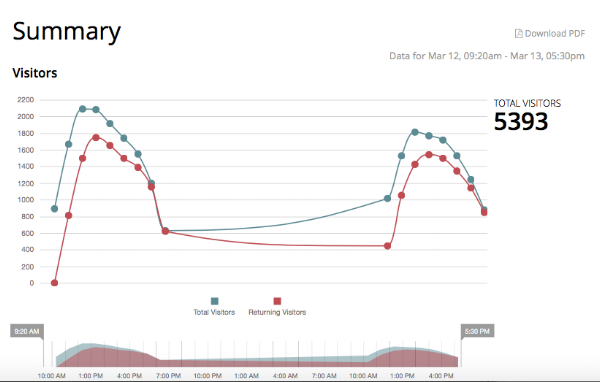
 Sometimes exhibitors want to know what proportion of visitors are new or returning. Exposure Analytics makes it easy to compare.
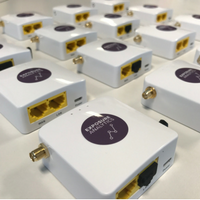
Our unobtrusive sensors pick up mobile devices as people get close to your stand. We’ll capture how many of them there are, the percentage who walked past and those who stopped, how long they stayed around for and what most attracted their attention.
We’ll work with you to analyse that data and assess the impact of your activity. As well as the raw figures, we can produce heat maps to reveal popular areas, flow charts to show how people moved around, make comparisons from one day to the next, or year on year for repeat events. Our clients use the data we provide to make key decisions for example, which shopping centres to revisit and which to cut from their list. One motor manufacturer redesigned their stand between motor shows based on our analysis of how people interacted.
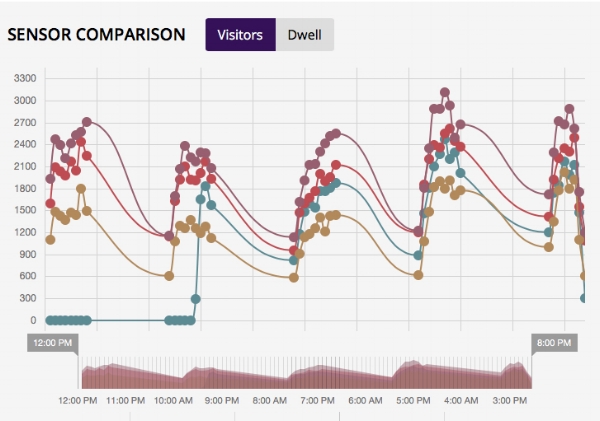
 Each colour represents a different sensor. It is easy to compare different parts of a stand for their respective popularity and engagement rates over a period of several days.
Experiential Marketing is on the rise
Automotive brands aren’t alone in the move towards experiential. There has been a huge increase in the amount of marketing budget allocated to these activities recently. One survey found that marketers expect to allocate up to 50 percent of their budgets for brand experience. Another that, while overall ad spend is dropping, there will be an estimated 11% average increase in experiential marketing budgets for 2017.
Even more traditional retailers like John Lewis are changing the way they market their products. This year they hired their first-ever manager of brand experience for their new Oxford store.
But as with all other marketing activity you need to be able to evaluate and try to calculate a return on investment. As marketing changes so do the tools to measure and monitor. As well as the standard figures and charts we provide from Exposure Analytics we can also add more value. By using our sensors at a shopping centre or event and in a dealership we can help you to determine what percentage of showroom visitors have seen your previous activity – (this is anonymised, we don’t know who they are, our sensors recognise the device).
There’s also our new Aperture system which builds on Exposure to reveal not just numbers but sentiment and demographics too. Our system uses face recognition software to identify a fascinating range of information about people visiting stands.
We use camera sensors behind a communications medium that can pick up the attention and dwell time from individual visitors. Such is the power of the system, it can tell a person’s gender and age in 96 out of 100 visitors and can even pick up their sentiment. All this of course without gathering any personally identifiable information. So you’ll know not only how many people stopped to have a closer look, but how they felt and whether they fit your target demographic.
With ever increasing amounts being spent on experiential marketing, can you afford not to properly evaluate the return on investment?
If you’re still guessing, talk to us about how you can start measuring.


