Read Article
Use cases
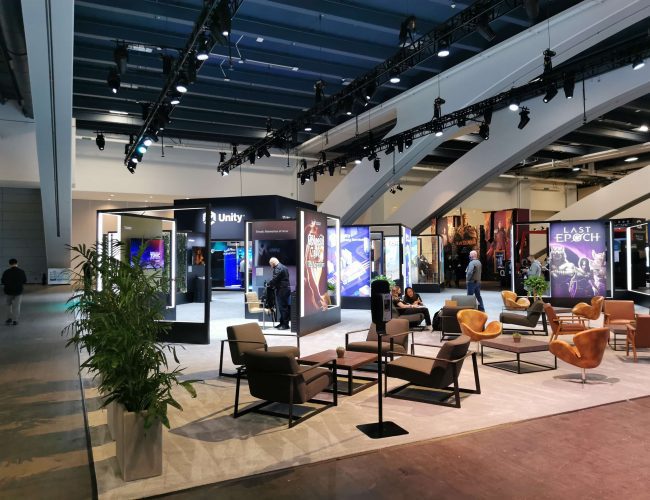
Organising large events and consumer shows takes a lot of time and money. They are crucial to getting new products and services in front of customers and showing them how they can help improve their own services as a result.
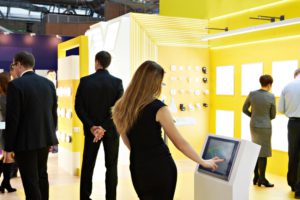
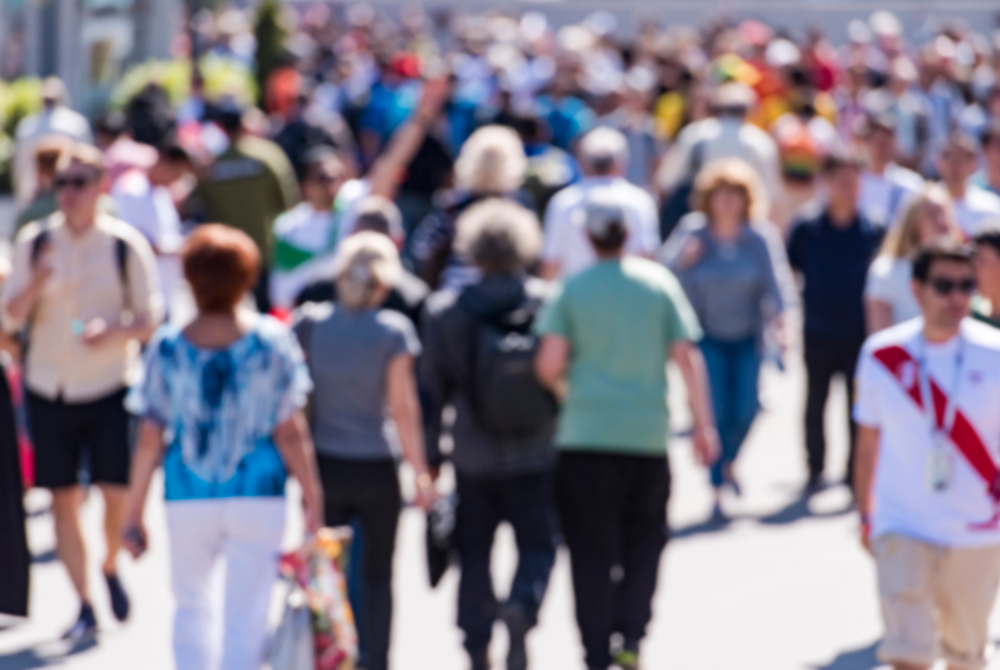
If your company is considering exhibiting at these events, then you must be able to analyse the data from them to see how your presentation and visibility are working. Using technology such as a people counter can be invaluable in determining how many people visited your stand and how long they stayed.
Let us take a look at how using our services from Exposure Analytics can improve your accuracy in visitor analytics and identify visitor trends.
We have worked with our clients on over Loading... events in some of the largest exhibition spaces around the world. Our clients are constantly telling us that events are one of the hardest elements of the marketing budget to justify as they are notoriously difficult to measure accurately. Our sensor solutions help solve that problem.

Our team of analytics experts spend time understanding what our clients want to measure and advising them on other metrics available through our state-of-the-art sensor system. Based on the data requirements, our team scopes out which sensors are required as well as determining the right location of the stand for optimum footfall and visitor engagement, and to capture the data that will help you assess your current event and improve future ones. We also work with our clients to formulate an install plan as well as getting them set up on their Events Dashboard.
Insights Dashboard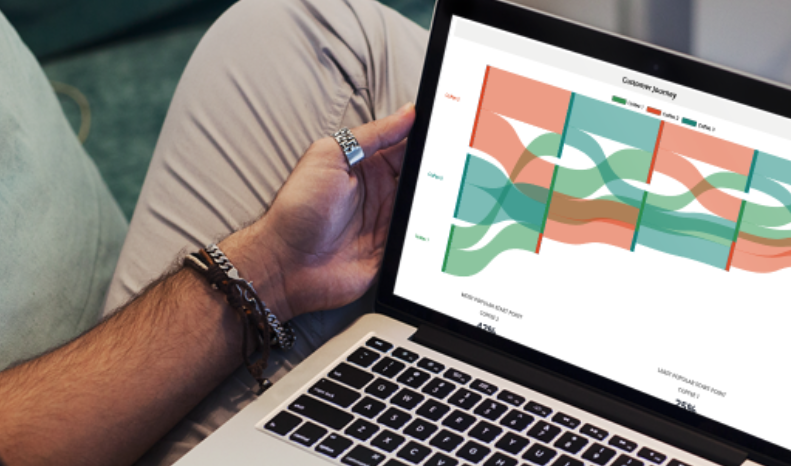
During the events the clients are able to use mobiles and tablets to access their Exposure Analytics dashboard, accessing real time data from the sensors. Clients can measure visitor footfall around their stand as well as the levels of visitor engagement to help them determine not just how many visitors engaged with their brand, but how visitors engaged with their brand. Based on this data, our clients can measure the value of the event and also adjust their space and staffing to encourage better results.
Insights Dashboard
After the event our clients can conduct more in-depth analysis of the data and join it together with data from other sources at the event (e.g. a market research survey that they have conducted). They can then use the insights gleaned using our solutions to plan improvements on various elements of their event for better performance in the future – the design of the stand, for example, to optimise the flow of visitors, or altering messaging based around demographic data. This information is also invaluable for justifying and securing future event budgets.
FAQs
We’ve got answers! Explore some of the most common queries on our FAQ and Glossary page.