Gather unique metrics about the movement and engagement of your visitors
The go-to event engagement Dashboard: Everything you need, one place
Hosting an event can be challenging. This is true whether you organise virtual or in-person events. We at Exposure Analytics know this well, having consulted with major venues and event organisers in over 35 countries.
There has been a call for a smarter tracking solution, one that offers live metrics on how customers are engaging with the space. This is why we have innovated the Dashboard, bringing events an all-in-one hub of the engagement data they need.
To keep a close eye on your event performance and, more specifically, your engagement with event attendees, we install smart sensors that collect critical insights into customer behaviour.
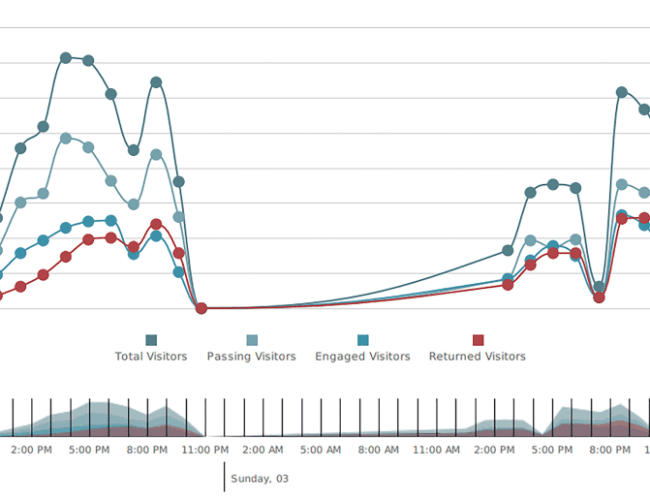
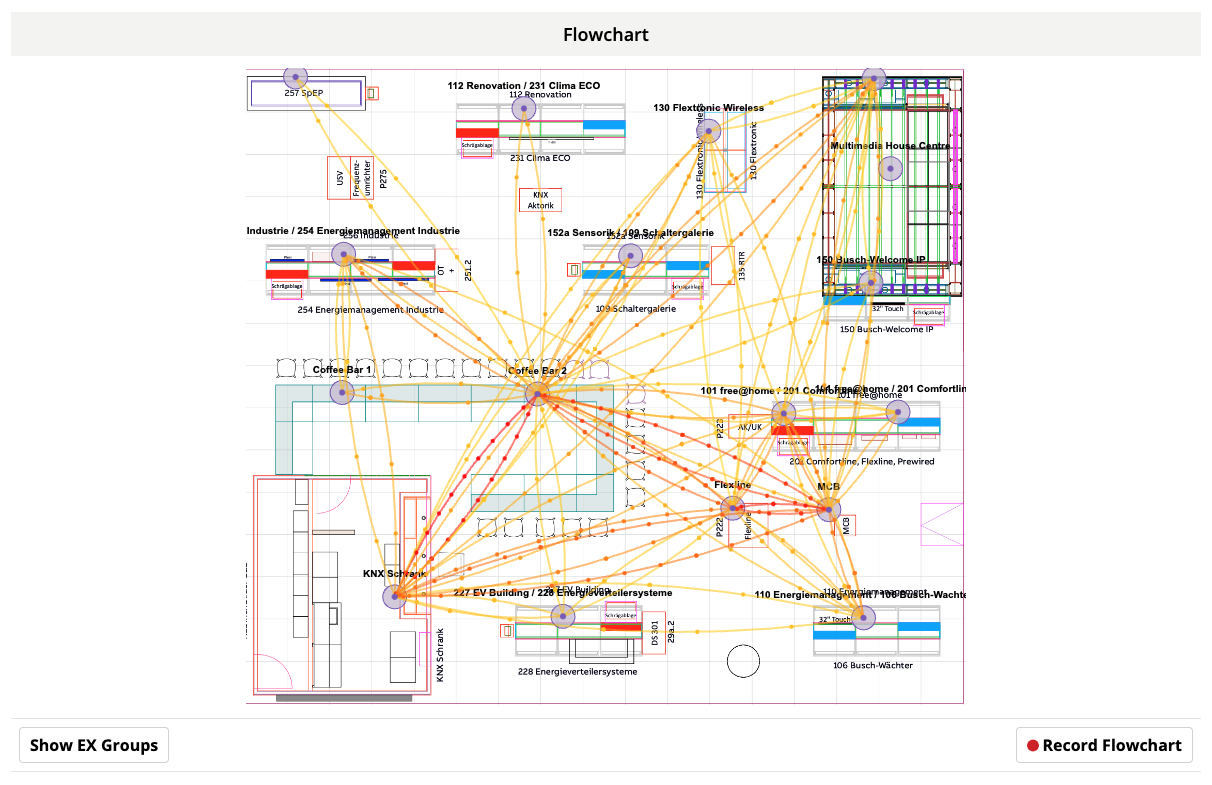
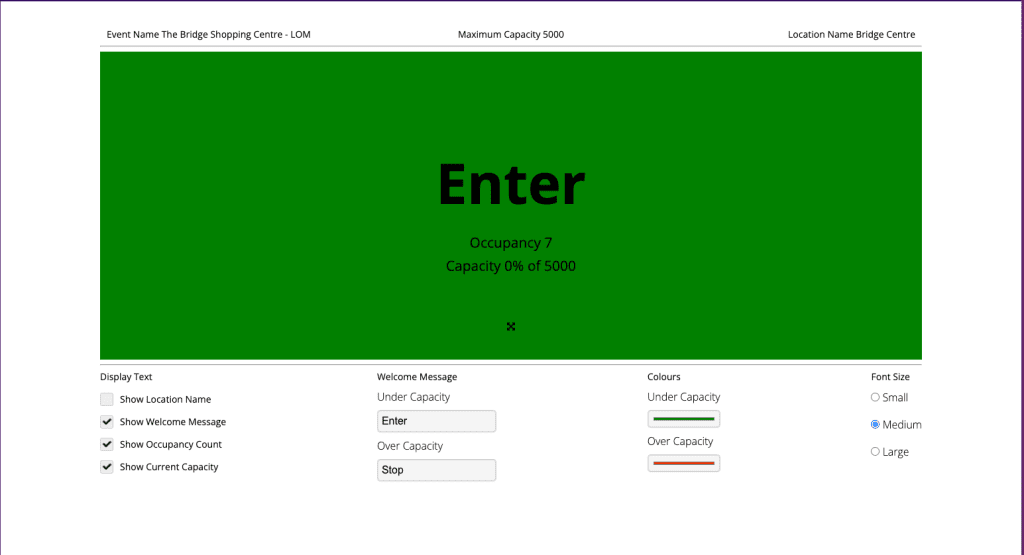
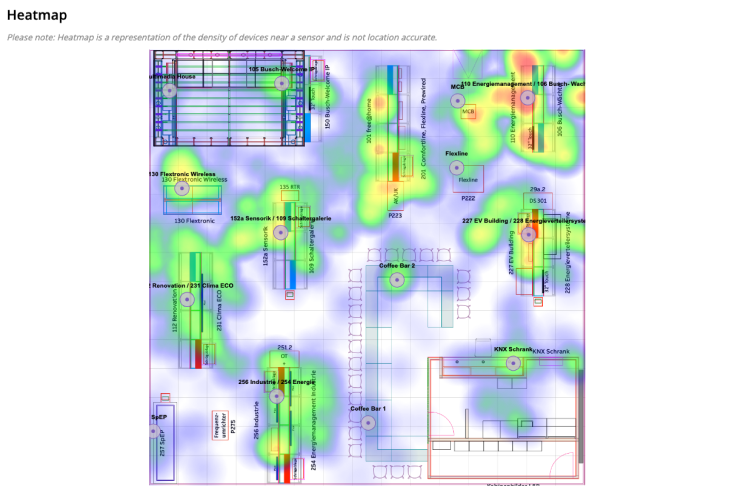
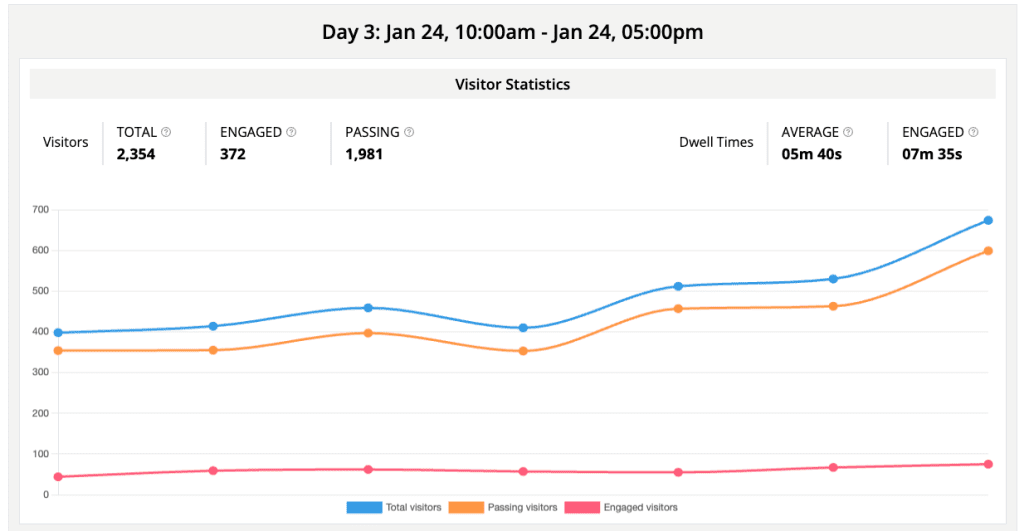
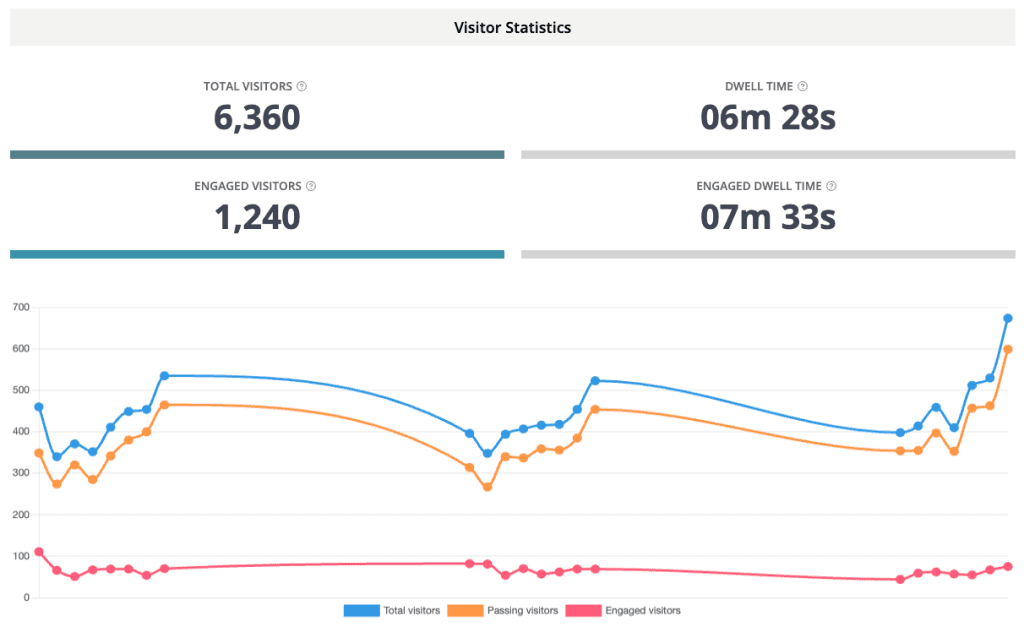
You can access the Dashboard through any desktop or smart device, from anywhere in the world, and gain instant access to vital metrics – like footfall, occupancy, flow routes, and more.
How our Dashboard can help you
At Exposure Analytics, our expert team has designed the Dashboard to help you improve your future event. We’ve built an intuitive system that accounts for valuable insights – all of which are important markers of customer engagement and event success.
How does the Dashboard work?
Our Dashboard takes a simple approach to event engagement. It functions on a cloud-based system, and is mobile-responsive, so you can access these insights from the furthest reaches of the globe.
Real-time insights are collected from our high-tech Apex sensors and Ex Sensors, which are positioned strategically throughout your event. The event data is condensed into a dynamic Dashboard.
Clients can even compare multiple events at once, export these analytics into a handy spreadsheet, or opt for API access to integrate the event engagement stats into their current reporting framework.
Some of the metrics we measure include:
– Occupancy
– Footfall
– Engagement
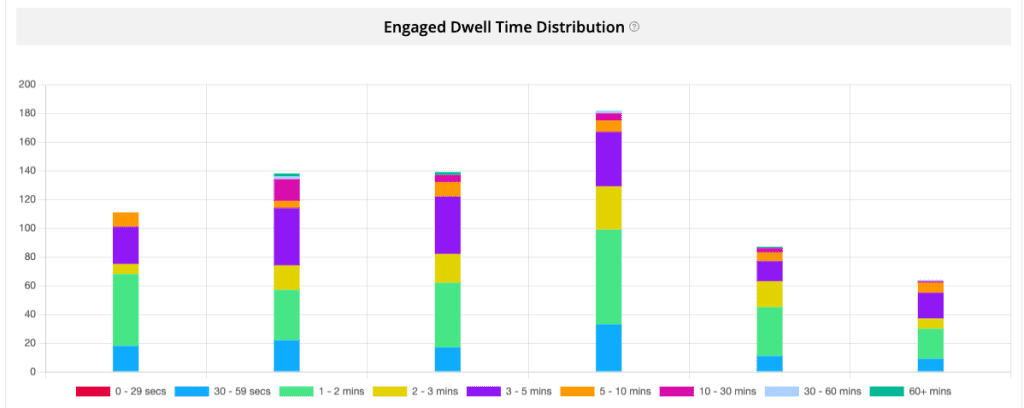
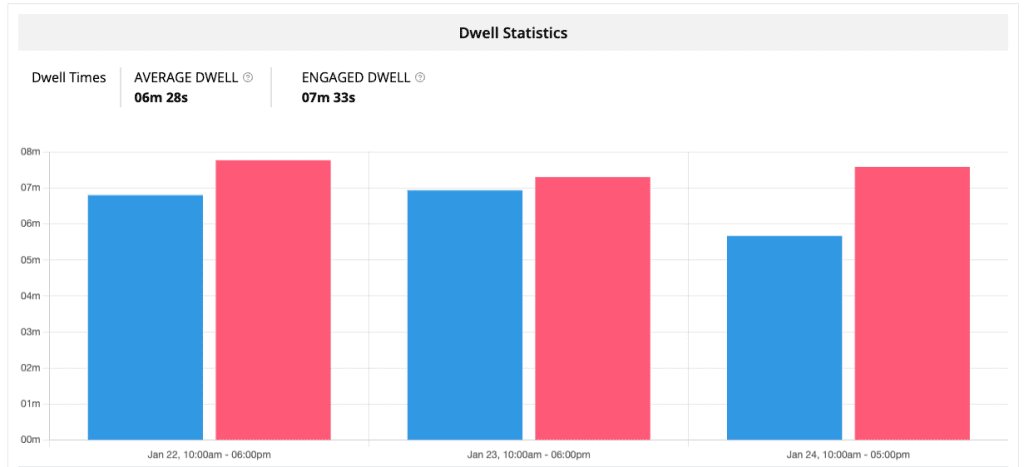
– Dwell time
– Heat maps
– Flow routes
– Staffing levels
– Tree maps
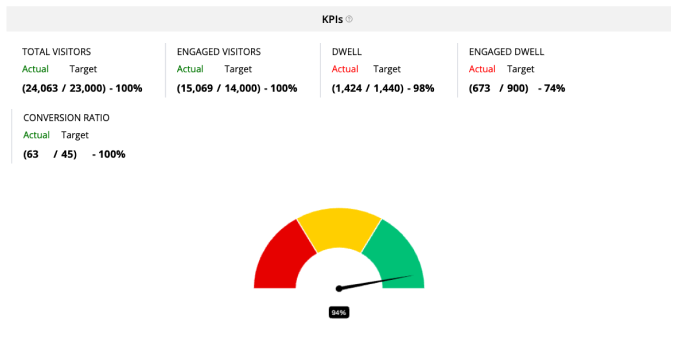
– Conversion ratio
Is the data available in real time?
Yes, all of the event data collected in your Dashboard display is available in real time. We pride ourselves in providing our clients with simple access to live metrics and event performance, with the ability to log on and view this data regardless of time or location.
This is how we stay competitive as a company and how our clients stay competitive with their events.
Like what you see? Explore our full range of event tracking products for more.
Powering experiences through insight
Measure the success of
your events and experiences
with our simple to install and
easy to use intelligent sensor
system.
Optimise your event or
experience based on real
time insights, from staffing
levels to prime placement of
your latest products.
Reflect on the insights from
your event and report back
to your wider team with
confidence in the accuracy of
your data
Our event engagement Dashboard in action
Whatever your industry, our event engagement Dashboard can offer you invaluable insight, providing an effective tracking solution for modern businesses.
Let’s take a look…
Case study
We have previously worked with Shelton Fleming, a business that collaborates with brands around the world producing summits, exhibition booths, and more to reach a B2B audience.
Based on collected data from Exposure Analytics around flow routes and dwell time, compacted into the Dashboard, Shelton Fleming could tell that visitors tended to have an engaged dwell time of around 14 minutes across the duration of their exhibition. This knowledge was utilised by Shelton Fleming and their clients to build a clear picture of which exhibitions and events were worth investing in, and which weren’t.
Businesses can apply our technology in many ways – like calculating and improving ROI, building a benchmark engagement score for future events, and reassessing their marketing strategy. These are just select examples of the potential applications our Dashboard could have! Plus, the statistics speak for themselves.
What the stats say:
– 52% of marketers think event marketing drives the best ROI (99firms)
– Event uptake is increasing with 61% of Gen Y and 63% of Gen Z saying they’ll be at more events in 2023 (EventBrite)
– For 70% of event organisers, live experiential events are a crucial revenue driver, making an effective tracking solution paramount (Forbes)
Data is king: Get premium insight into your events with the Dashboard
With the rise in event attendance, harnessing a smart tracking solution is vital. The Dashboard is an award-winning solution that provides you with real-time insights into precisely how your event is performing. It’s footfall, user behaviour, queuing time, flow routes, engagement, and more – all in one place.
Interested? Find out more about what we do or simply get in touch at your earliest convenience. We look forward to hearing from you.
What Can You Learn From Visitor Analysis For Your Events?
It’s natural to wonder what’s holding back an event [...]
Your Ultimate Exhibition Checklist
Showing at an exhibition is a fantastic but overwhelming [...]
35 Experiential Event Statistics to Inspire Your Next Event
Looking for experiential event statistics that prove the value [...]
Awards
CONTACT EXPOSURE ANALYTICS
Want to get in touch? Drop us a line by using the contact form below or give us a call on 0203 982 0997