Services
Our technology has helped major global brands and agencies measure over Loading... events. Discover our range of award-winning solutions for event analytics designed to help you get the most out of your experiential marketing.
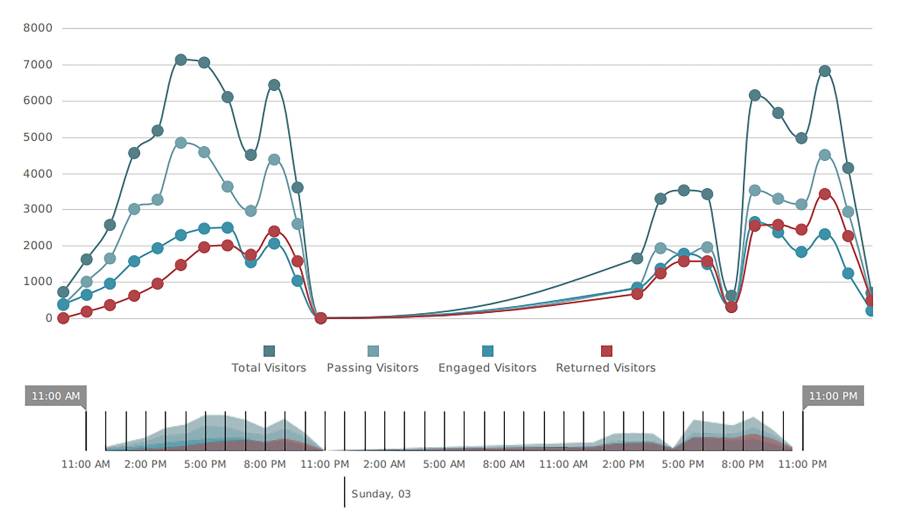
Insights Dashboard
The go-to event engagement Dashboard: Everything you need, one place.

Competitor Benchmarking
No more guesswork. Get accurate Competitor Benchmarking insights for your sector. Our Booth Scoring delivers hard data on competitor performance.

KPI’s
With our solutions, you can fine-tune your approach and ensure your event is driving the desired outcomes.
How do we measure insights?
Apex Sensor
Apex counts individuals within a clearly defined space. Monitor entry and exit points and live footfall counts in any size space starting from 1m2.
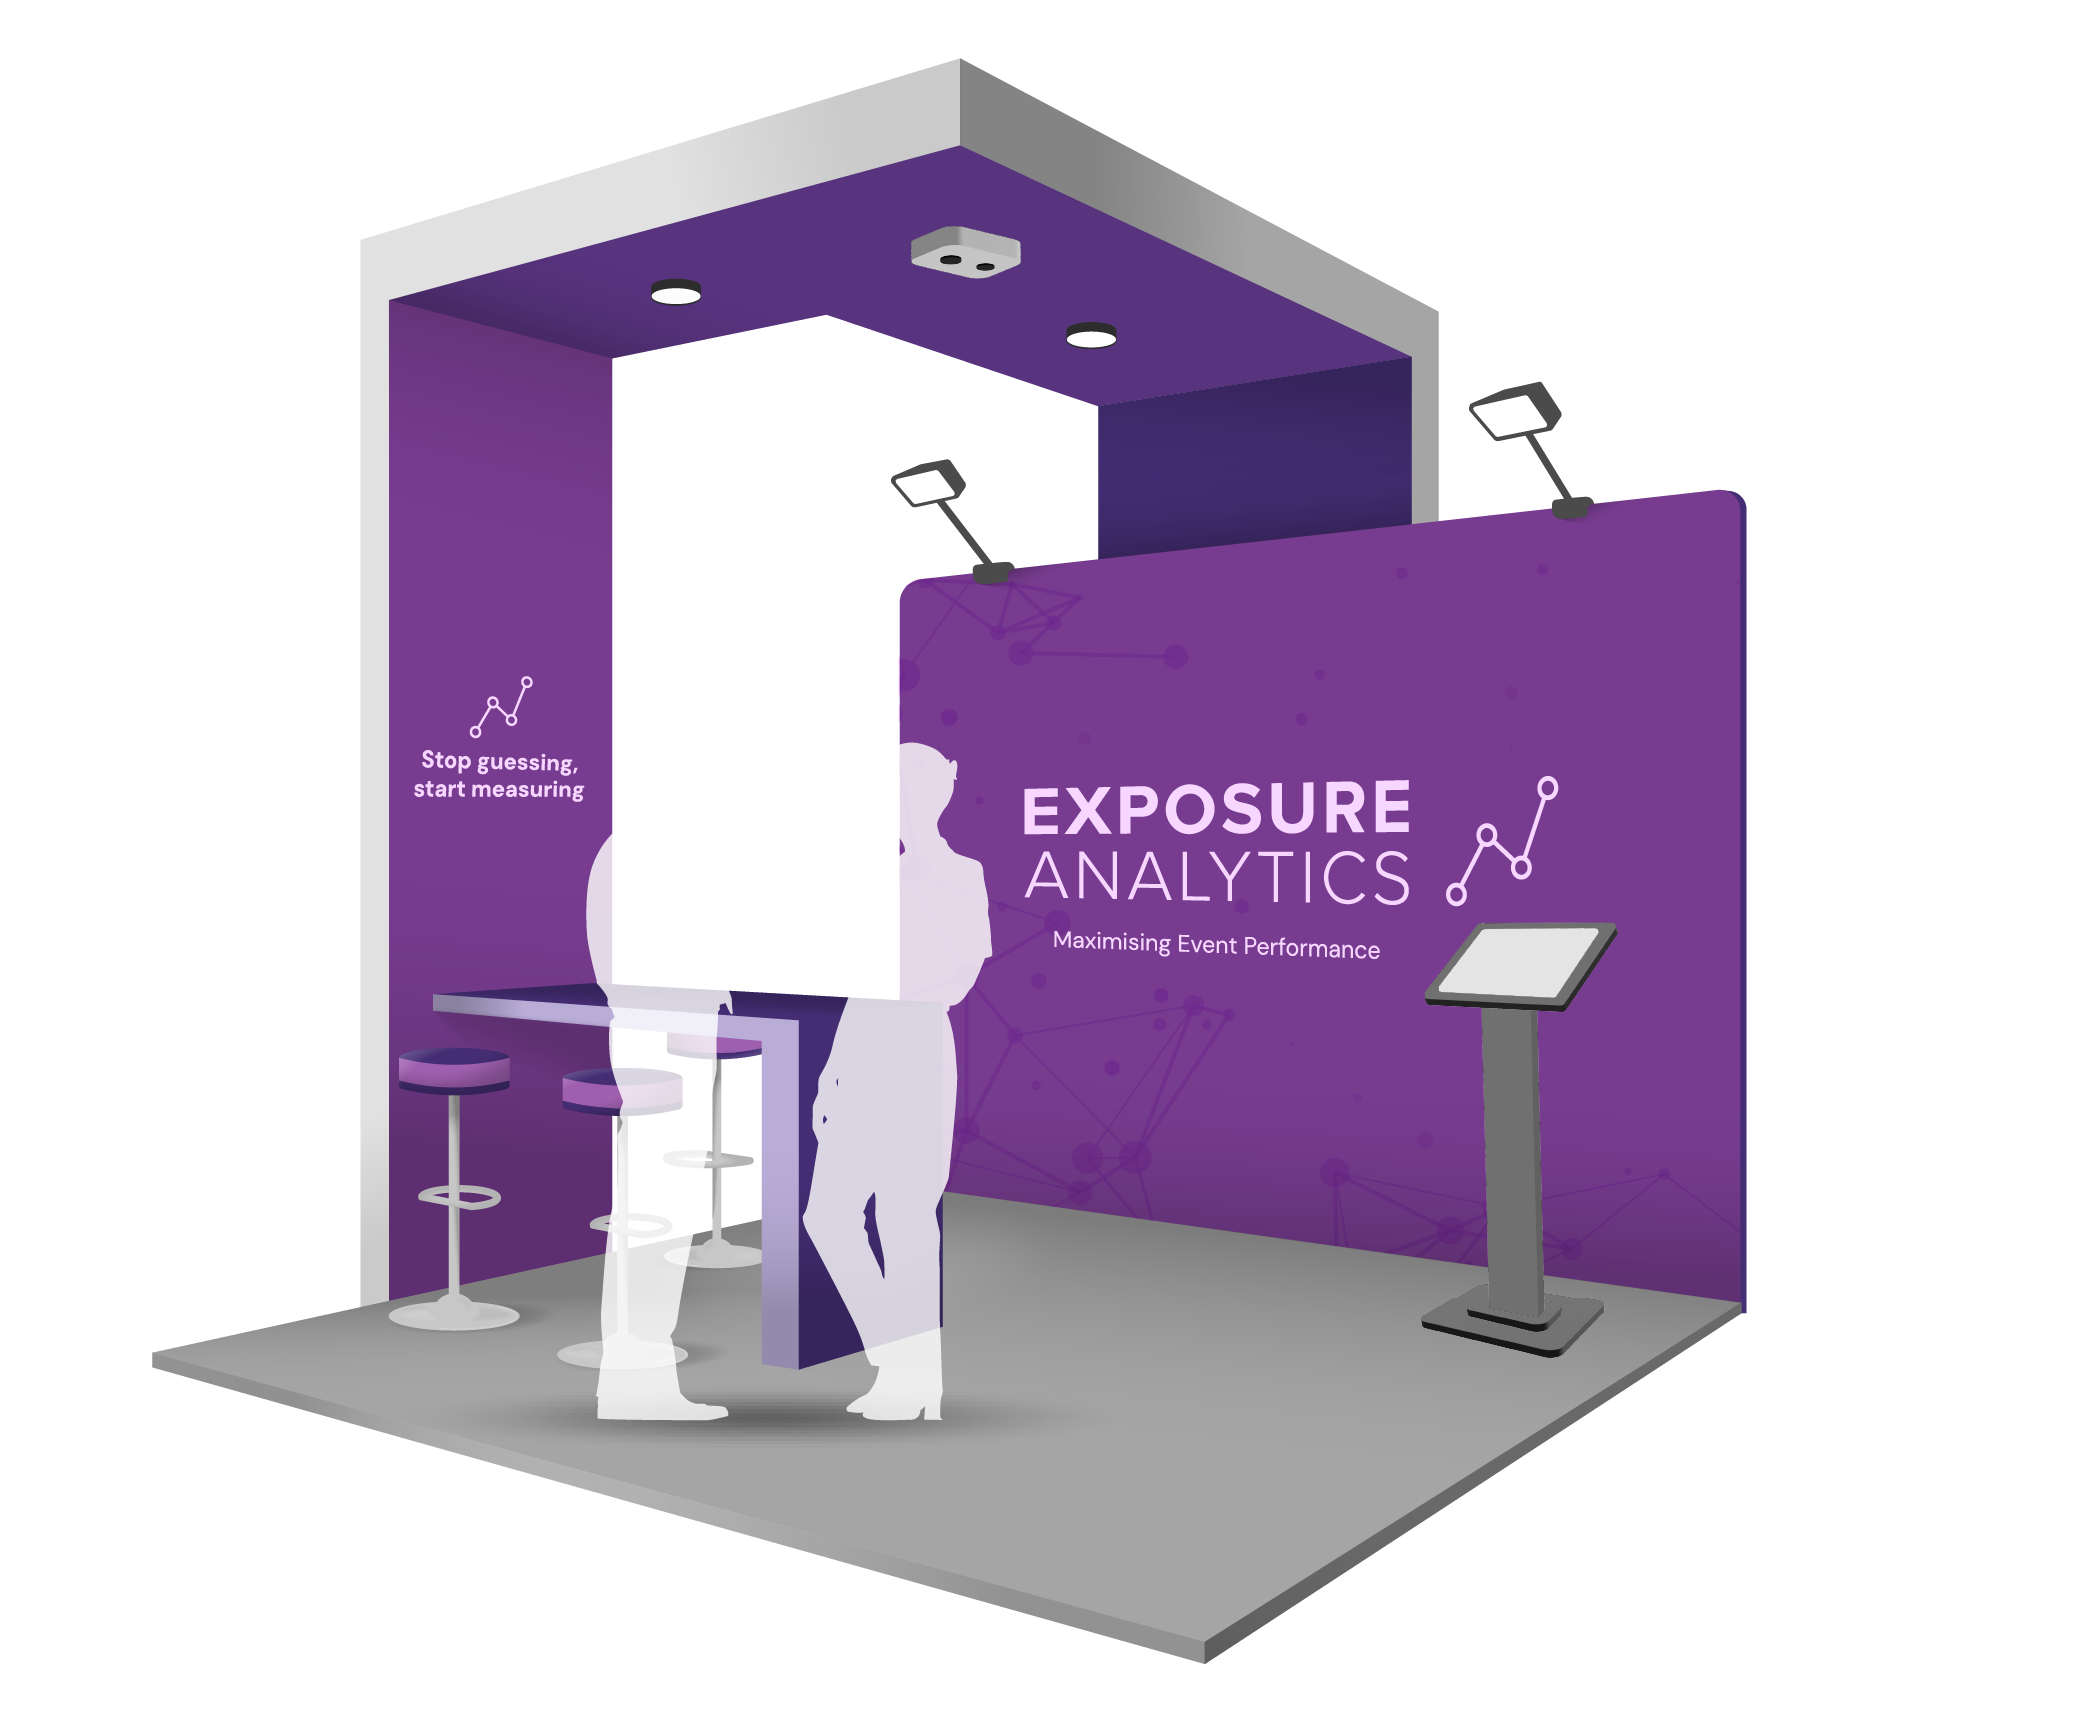

EX Sensor
Our EX Sensors use wifi signals from devices to capture footfall, dwell times, engagement rates, flow routes and heat maps at events and activations.