Our client, a major household name, was exhibiting at the most important event in their annual calendar.
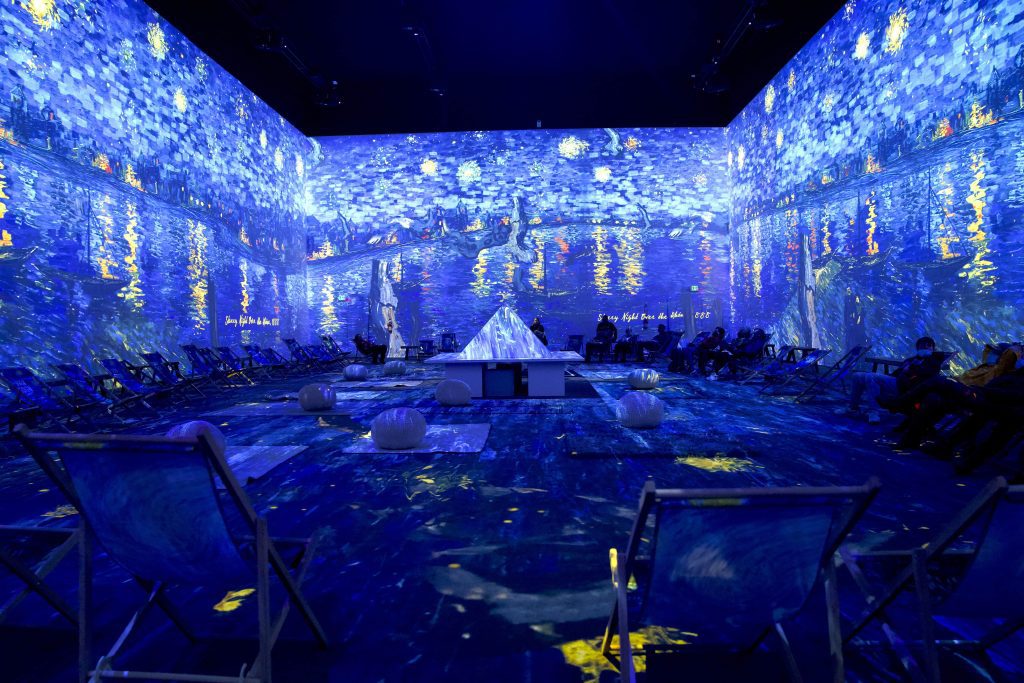
They appointed a prominent experiential agency to design, create and deliver a first-class immersive experience for their consumers.
The Challenge
As companies increase their experiential budgets, the pressure to prove return on investment grows. The enormous amount of time, energy and money that goes into large-scale experiential events such as our client’s stand at a major event warrants detailed evaluation. But how best to measure? Organisers provide footfall figures but how accurate are they? Can you trust your recollections of when a stand was busy and when it was quiet? Do you know which zones generated the most engagement and how people flowed between the different sections of the stand. Historically, our client has used multiple evaluation tools including onsite surveys, post event surveys, press coverage, lead capture information, badge scanning, and social media activity to evaluate events. They are always looking for ways to enhance this and use both qualitative and quantitative information to measure success.
The Solution
Data captured by Exposure Analytics sensors, which anonymously pick up signals from wifi enabled devices, allowed our client and their experiential agency to get accurate footfall figures. The numbers did vary from the organiser’s official total, but after investigation, it was determined that the sensor data was the accurate figure. Along with overall visitor numbers the beacons also plot flow routes around the stand, capture dwell time in each zone, and generate heat maps. All of the data is displayed in a simple format that is easy to understand and feed into real time evaluation and post-event wash-up meetings.
The Data
Seventeen Exposure Analytics sensors captured the movements of over 50000 people in and around our client’s stand at the event. We can see the overall totals and how the visitor numbers fluctuate over the four days.
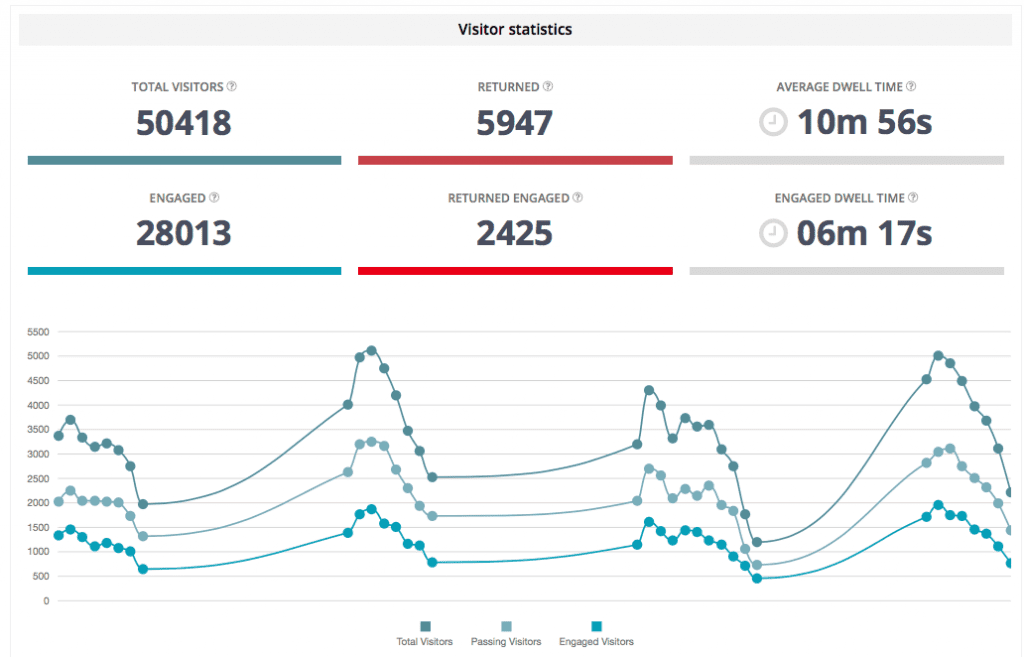
The number of engaged visitors is fantastic. Overall, the data collected allows our client to get a full picture of the most and least popular areas and how that changed over the course of the event – this can be displayed as a tree map and also as a report on the number of people near to each individual sensor.

The data revealed that zones considered to have high importance internally weren’t always the best performing, a surprise to some stakeholders. Having accurate impartial data allowed conversations to take place about how best to plan the stand for the next big event, based on consumer interest.
We can also see the routes people used to move between zones, and compare the actual flow with expected behaviour. From within the Exposure Analytics platform this data can be viewed as a video showing how the flow routes vary over the four days.
Other data that can be added to complete the picture is the average dwell time in each zone, broken down day by day.
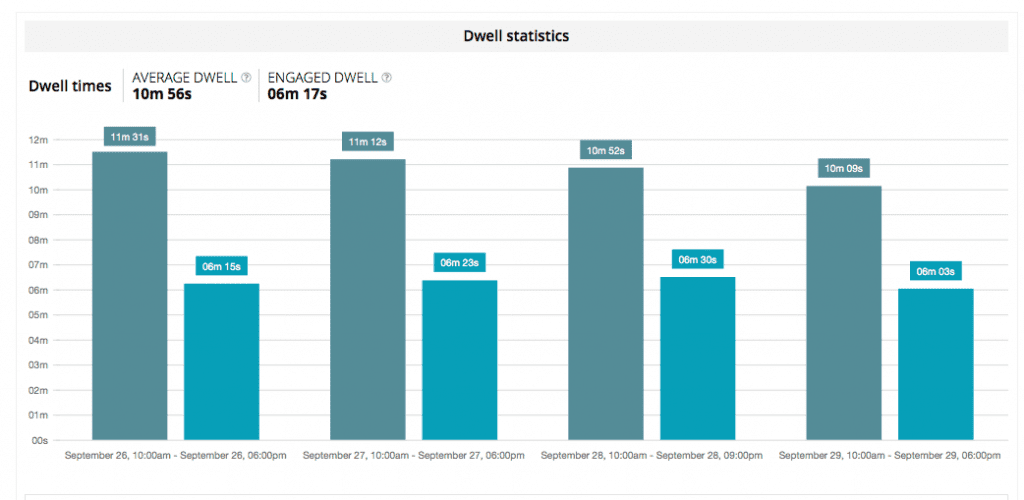
This information can be used to tweak the stand during the course of the event, in terms of layout, staffing numbers, and how people are directed around the experiences. Post event, the detailed analysis from each sensor can be used in conjunction with other data and feedback to fully evaluate the impact.
The Results
Having been initially disappointed that the visitor numbers for their stand were only around 1/3 of the organiser’s official figure for attendees, discussions with the event organisers revealed that in fact the sensor data was a far more accurate record of the numbers of people attending. Images from cameras on the stand proved that the sensors were spot on with their visitor count. The data for each zone reduces subjectivity and emotion when considering which areas performed best and how to plan the stand for the next big event. In conjunction with qualitative evaluation via surveys, lead capture, and other tools, the quantitative analysis builds a rounded picture of the impact and influence of the experience created.
Our client’s view
”The data generated was incredibly useful to help us to accurately assess our impact. Had we relied on the organiser’s attendance figures, we would have been very disappointed in the footfall at our stand. Senior managers questioned why we didn’t have a higher percentage of show visitors and we were able to explain the true picture. It’s hard to argue for increased investment if it seems like the event isn’t working for us. The detailed picture of what attendees were interested in has allowed us to have open discussions internally about what to focus on in future.”
The Future
Accurate, objective information about the number of people visiting a stand and each of its zones, along with flow routes, heat maps, and dwell times is fantastic for evaluating an event. The value increases when planning for future events with the ability to feed in all that has been learned to the design and creation of the next set of experiences. Accurate data is an important part of the process to achieve effective experiential.
Get a demo
If you want to measure the effectiveness of your experiential activity please get in touch to find out how Exposure Analytics can help you.