Production Bureau supported their client, a leading technology company, with the delivery of a bespoke exhibition stand for the Adobe Summit 2019. Standout features were TV and media screens, displaying content and being used as presentation tools. Visitors were encouraged to engage with their client’s content via a bespoke interactive interface. Production Bureau also installed a coffee bar and barista.
The Challenge
Production Bureau wanted to gather detailed metrics about the movement and engagement of stand visitors to help them understand how their stand was performing. Multiple screens and a coffee bar offered ample opportunity for visitors to stop and engage and Production Bureau wanted to understand if they’d achieved their aim of creating an inviting environment for visitors and staff.
The Solution
Three Exposure Analytics sensors were setup on the stand and monitored the delegate numbers, dwell and engagement time. The discreet sensors also captured information about busy areas of the stand and flow routes between the different sections.
The Data
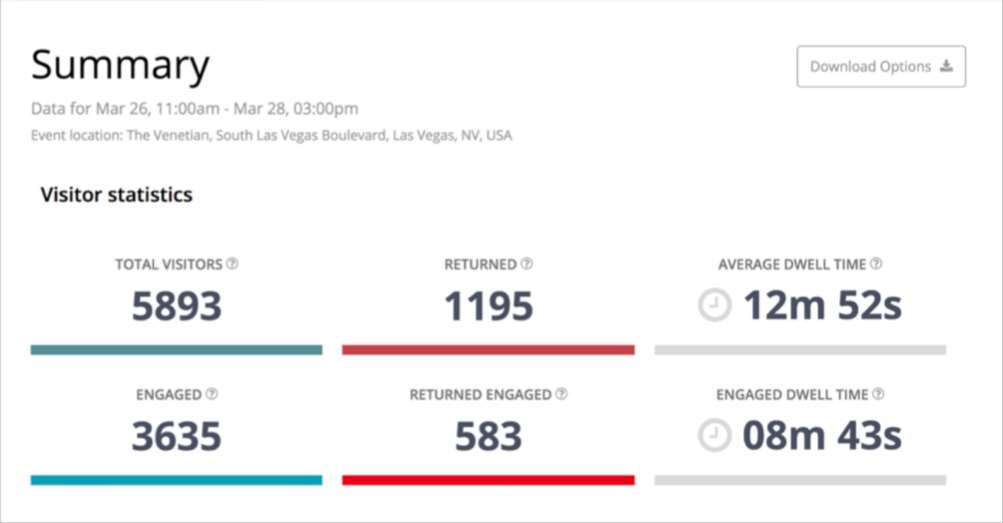
The total number of engaged visitors was 3,635, this represents the number of prospects that dwelled for more than 60 seconds at the stand during the three days. Engaged dwell time of nearly nine minutes was high due to staff chats, photos, demos and the coffee.
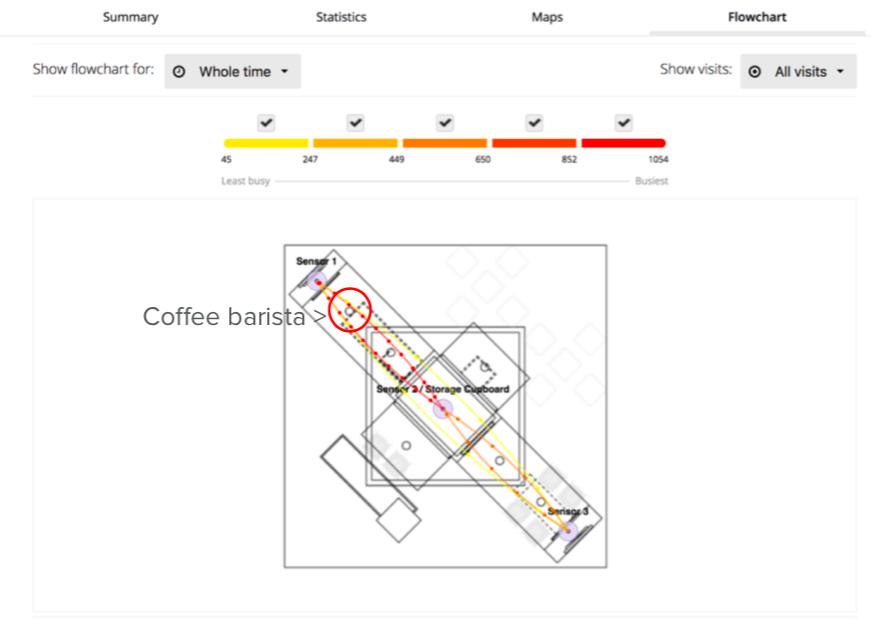
The flow chart demonstrates the value of coffee to the stand, the density of traffic flow from the coffee stand to the centre reception is very clearly illustrated.
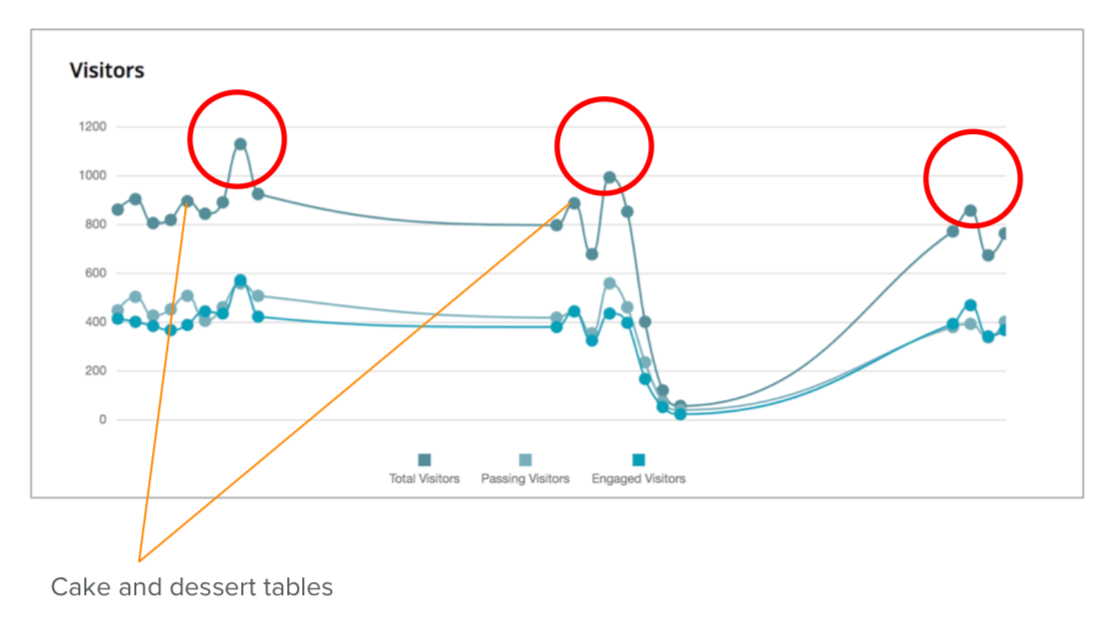
This graph shows that there are three peaks on each of the days, which correspond with free drinks – shown by the red circles. It also shows the dessert uplift in the afternoon, when visitors came back after lunch to get desserts. On the stand we observed increases around this time and for afternoon coffees. The results show that visitor numbers lessened incrementally over the three days, which Production Bureau expected.
The Results
Data revealed by Exposure showed a number for total engaged visitors and that roughly a third were scanned. Data also revealed a high dwell time due to conversations with stand staff and product demonstrations. Visitor flow and dwell time data also showed the value of having a coffee stand as part of the activation. The coffee queues were fantastic for conversion and conversation as attendees were happy to chat while waiting; some of the best opportunities came from these queues.
Heatmaps confirmed that the central area was the busiest space and accepted the largest number of attendees, with strong flow from the coffee area. It also showed that the rear of the stand was relatively quiet, prompting the Production Bureau to recommend moving the touchscreens in future and facing them in a different direction.
Our client’s view
“The sensors were excellent with straightforward set -up and configuration and could be checked from the handset daily. It allowed us to make evidenced recommendations to our client to improve their stand. Next time we’d like to add two more sensors to give us a more detailed picture of the stand and its impact.
The Future
Production Bureau have got a clear understanding of how their stand performed at Adobe Summit and have already used the data to plan how they can improve on an already successful event next year.
Get a demo
Accurate, objective data is so important to measure your work, along with a careful analysis of the results. If you are looking to evaluate and enhance your event stands please get in touch to find out how we can help you with the insights you need for great live brand experiences.