
They produce summits, forums, roadshows, exhibition booths, customer centres, product showcases and brand activations along with film and digital content.
The Challenge
Agencies want to do their best for their clients, but it is hard to measure the impact of experiential activity. When agencies produce exhibition and event stands they need to be able to assess their work and good agencies are always looking for ways to improve and enhance their services. Shelton Fleming are working to develop an internal engagement score for their projects to share with clients to be more insightful and able to design better for the brands they support. To do that, they need accurate data from the events and exhibitions they produce work for. In the past we have used surveys and tracked the use of interactive screens as well as investigating the use of beacons to track downloads; difficult, particularly with new data protection rules.
The Solution
Exposure Analytics offers a passive data capture tool used by Shelton Fleming. It can show the flow of people past a stand or activity and engagement numbers – so it’s easy to see the impact. Heat maps and data analysis highlight busy times and specific locations by day and by hour. Thanks to the data captured, Shelton Fleming can provide clients with more insight and together they can start to look at the return on investment for events and exhibitions. Shelton Fleming want to build up a picture over a program events or year on year so that they, and their clients, can decide what’s worth investing in.
The Data
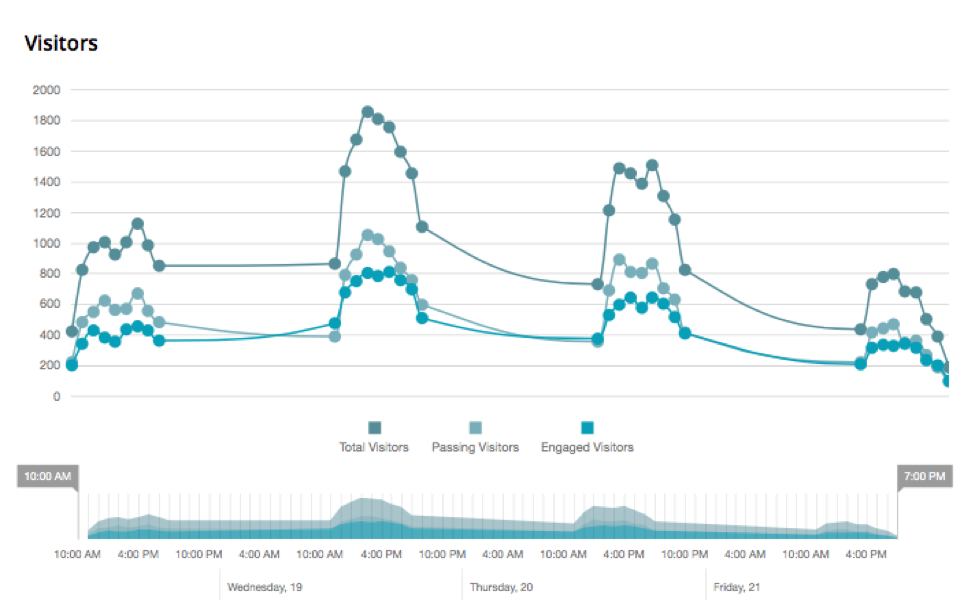
Four Exposure Analytics sensors were used for Hitachi Rail at the Innotrans event in Germany. The technology enabled them to see how many passing visitors they engaged, which areas of the stand were the most popular, the routes taken around the stand and the dwell time for each area. We can easily see that day two was the busiest of the four in terms of visitor numbers and engaged visitors:
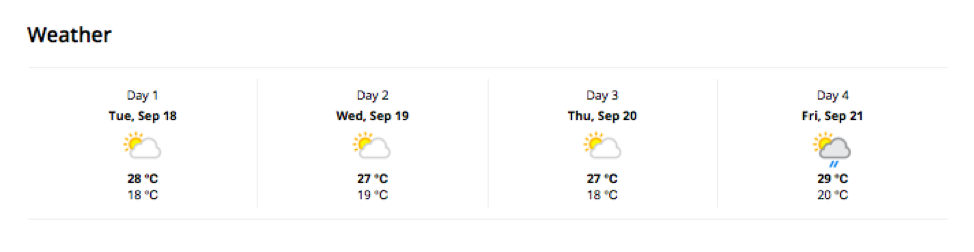
We can check whether the weather had an impact on visitor numbers, sometimes it makes a clear difference – but not in this case.
Multiple sensors across the stand each yielded individual visitor numbers – enabling the client to map which areas of the stand were more popular than others.
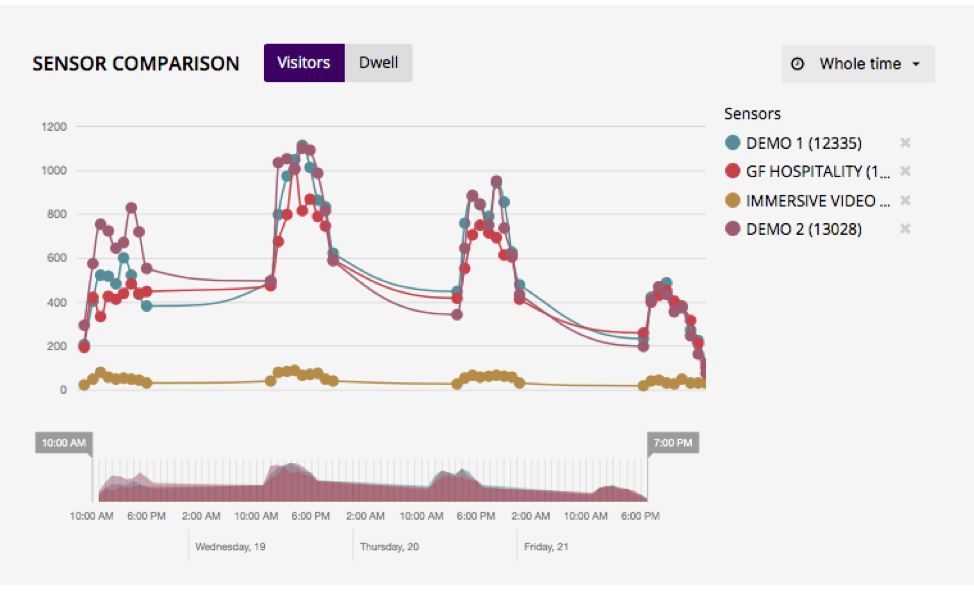
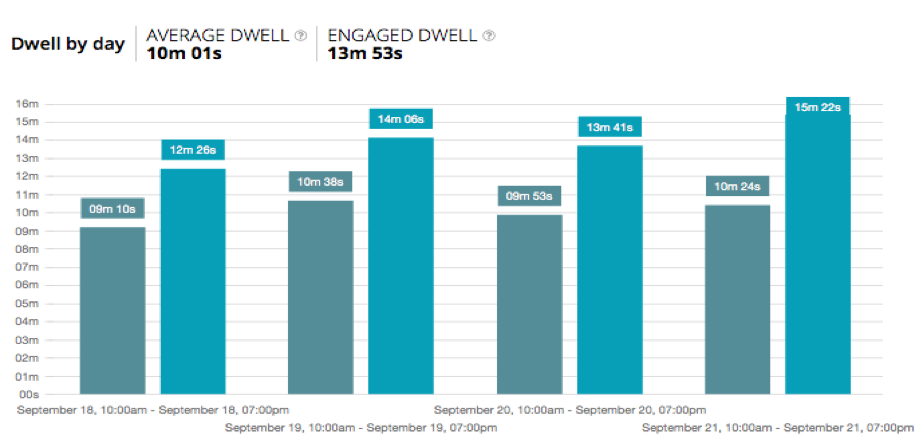
We can see that the immersive video area numbers were low. This was because it was an experience for only 1 person. However, when we dig deeper into the data, making full use of everything the sensors are telling us, we can see that actually, the engaged dwell time for that area is 12-15 minutes. This means that those people who spent time in the immersive video, really did engage, reinforcing for the client that this was a good return on investment.
The Results
For the first time, Shelton Fleming are now able to independently capture a full picture of the number of people who see and engage with their activity. The Hitachi Rail example shows that it’s not just about capturing accurate data, but also being able to evaluate that data and look at the impact activity had in terms of both numbers and engagement. They are looking forward to comparing data from event to event and year by year to help guide their clients’ decision-making and better design. Added to this, Shelton Fleming is looking at producing engagement scores for clients and letting them know how their activity compared to a stand of a similar size.
Our client’s view
Teresa Crook from Shelton Fleming explains:
“Using Exposure Analytics gives us insight into what we do; we’ve never really been able to get a true feel for numbers engaging with our clients’ stands before. We see it providing more value over time and we can start to improve our design solutions. The data we collect on behalf of our clients will allow us to build a benchmark engagement score.”
The Future
Shelton Fleming and their clients are already finding the data captured incredibly valuable to assess the impact of their work and believe that its value will increase over time. They can start to design more effectively, compare and contrast different events and locations, adapt layouts and activities and assess the impact any changes have.