Looking for experiential event statistics that prove the value of face-to-face marketing? Despite economic pressures worldwide, brands are increasing their investment in experiential marketing events – and the data shows us why.

As experts in the world of event analytics, we’ve watched firsthand over the years as our clients, from emerging startups to huge global brands, prioritise experiential events. 

These immersive live events pay dividends when it comes to engaging attendees and driving meaningful live experiences that stick with people. Let’s see exactly how.

Market Growth and Investment 

Why are more brands than ever choosing to invest in live experiences like experiential events despite tough economic times worldwide? 

Simply, because it’s proving too valuable to cut. Hard times can sometimes focus budgets more effectively on what really works.

If you’re considering investing in experiential events you’re in good company because these experiential event statistics prove live events are in continued growth. 

  • The experiential marketing service market is projected to reach £57 million by 2027. (Source: Business Research Insights)
  • 21-50% of marketing budgets are expected to be allocated to experiential marketing by CMOs. (Source: Freeman)
  • 70% of companies are planning to increase their total marketing budgets in 2024. (Source: Splash)
  • On average, 14% of a marketing budget goes toward event marketing. (Source: AMEX GBT)
  • According to the IPA’s quarterly Bellwether report, spending on events rose by 23.1% in the first quarter of 2024. (Source: IPA)
  • In a study with 750 senior brand managers, 80% had increased their experiential event budget in the last 3 years. (Source: Gradient)

Effectiveness and ROI

Any aspect of your marketing mix has to bring return on investment (ROI) otherwise it isn’t worth pursuing. The stats below tell a compelling story: live events consistently outperform traditional marketing channels in terms of ROI. 

For brands watching their budgets carefully, experiential marketing offers measurable, significant returns. Get to know how.

  • Companies experience 10x the ROI from attendees versus non-attendees. (Source: GTM Partners)
  • 83% of marketers say events are critical for their business growth. (Source: Splash)
  • 80% of respondents say in-person events are the most trusted marketing channel, a 5% increase from 2023. (Source: Freeman)
  • 77% of marketers say events are the most effective marketing channel for their company. (Source: Splash)
  • 65% of brands say events/experiential programmes are directly related to sales. (Source: EventMarketer)
  • 52% of respondents say experiential events drive more business value than other marketing channels. (Source: Splash)
  • 79% of marketers drive sales through organised brand events. (Source: G2)
  • 93% of US companies using event-led growth meet pipeline/revenue goals, compared to 76% of those who don’t. (Source: Splash)

Measurable Impact

Want more granular data on how customers respond to experiential events in order to justify experiential event planning for your own marketing spend? Here are the top experiential event statistics that show just how customers respond to these kinds of activations.

  • 85% of consumers are more likely to purchase after attending a live marketing event. (Source: EventTrack)
  • 91% of consumers have more positive feelings about brands after attending events. (Source: EventTrack)
  • 74% of attendees report improved opinion of the company/brand after attending an event. (Source: Zippia)
  • 82% of attendees prefer in-person events, with 17% saying preference depends on the topic. (Source: Freeman)
  • 70% of users become regular customers after an experiential marketing event. (Source: EventTrack)
  • 93% of consumers claim live events have a larger influence than TV ads. (Source: Forbes)
  • 87% of consumers are more likely to purchase a product after a positive brand experience” (Source: Epsilon)

Brand Impact and Perception

Live events create lasting impressions that digital marketing alone can’t match. For brands looking to build trust and loyalty, the face-to-face element of experiential marketing proves particularly powerful. 

This handful of experiential event stats prove this in spades.

  • 71% of younger generations report increased trust following brand interaction at live events. (Source: Freeman)
  • 85% say trusting a brand is critical for purchase decisions. (Source: Freeman)
  • 72% of respondents who attended an event in the past 6 months said they were significantly more likely to have positive perceptions of the brand. (Source: Freeman)
  • 64% of people surveyed said the halo effects from these interactions lasted at least a month. (Source: Freeman)
  • 65% of customers say that product demos and live events helped them understand the product better than any other advertising method. (Source: Event Marketer)
  • 77% of respondents in a study said they trusted brands more after interacting with them at a live event. (Source: Freeman)

Social Media and Content Generation

Live events drive significant social media engagement, extending their impact far beyond immediate attendance. This amplification adds considerable value to investment in experiential marketing.

  • 98% of consumers create digital or social content at events. (Source: EventTrack)
  • 96% of millennials take pictures or videos at brand events. (Source: G2)
  • 86% of people open and review shared experiential content. (Source: G2)

Experiential Event Content Preferences

Finally in our list of experiential event statistics, we thought you might find it useful to know exactly what kind of content customers prefer from their events and who you’re pitching it to. That way you let it guide your own plans. 

All the data points towards attendees preferring interactive, hands-on experiences. What makes this even more interesting is that this preference is reflected in many of our inspiring experiential marketing examples from leading brands. 

  • 56% of attendees prefer hands-on interaction or participatory activities. (Source: Freeman)
  • 52% of attendees want networking events focused on discussing industry challenges. (Source: Freeman)
  • 70% of attendees prefer to receive training and professional content in person. (Source: Freeman)
  • 48% prefer informal meetings with subject-matter experts. (Source: Freeman)
  • By 2030, workforce composition will be: Gen Z: 35%, Millennials: 40%, Gen X: 20%, Boomers: 5%. (Source: Freeman)

Measure Your Experiential Investment

If you’re opting for an experiential marketing strategy, we understand that you’ll want to ensure your investment is paying off. 

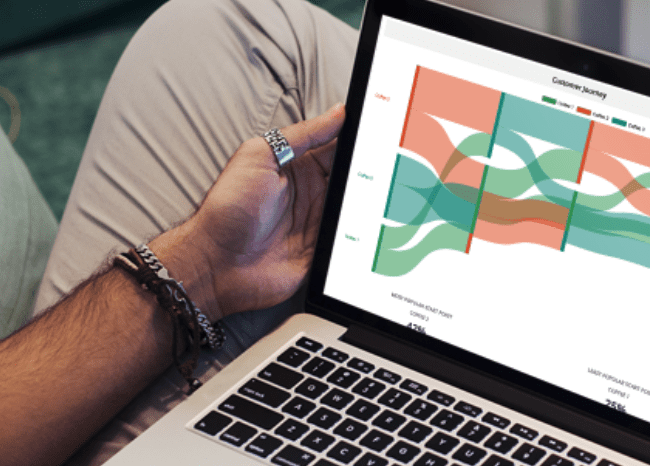
While the experiential event statistics above prove that these unique branded events can have huge impact, it often takes refinement before you find the thing that works for your market. Measure exactly how attendees are engaging with your event with our smart event tracking sensor technology with experiential data like:

  • Engagement rates and dwell time
  • Footfall and traffic flow patterns
  • Heat maps of popular areas
  • Real-time crowd density

Plus more custom metrics are available to view in a format that works for you on our customisable data Dashboard

Get in touch with the experienced team at Exposure Analytics to talk through your needs and arrange a demo.