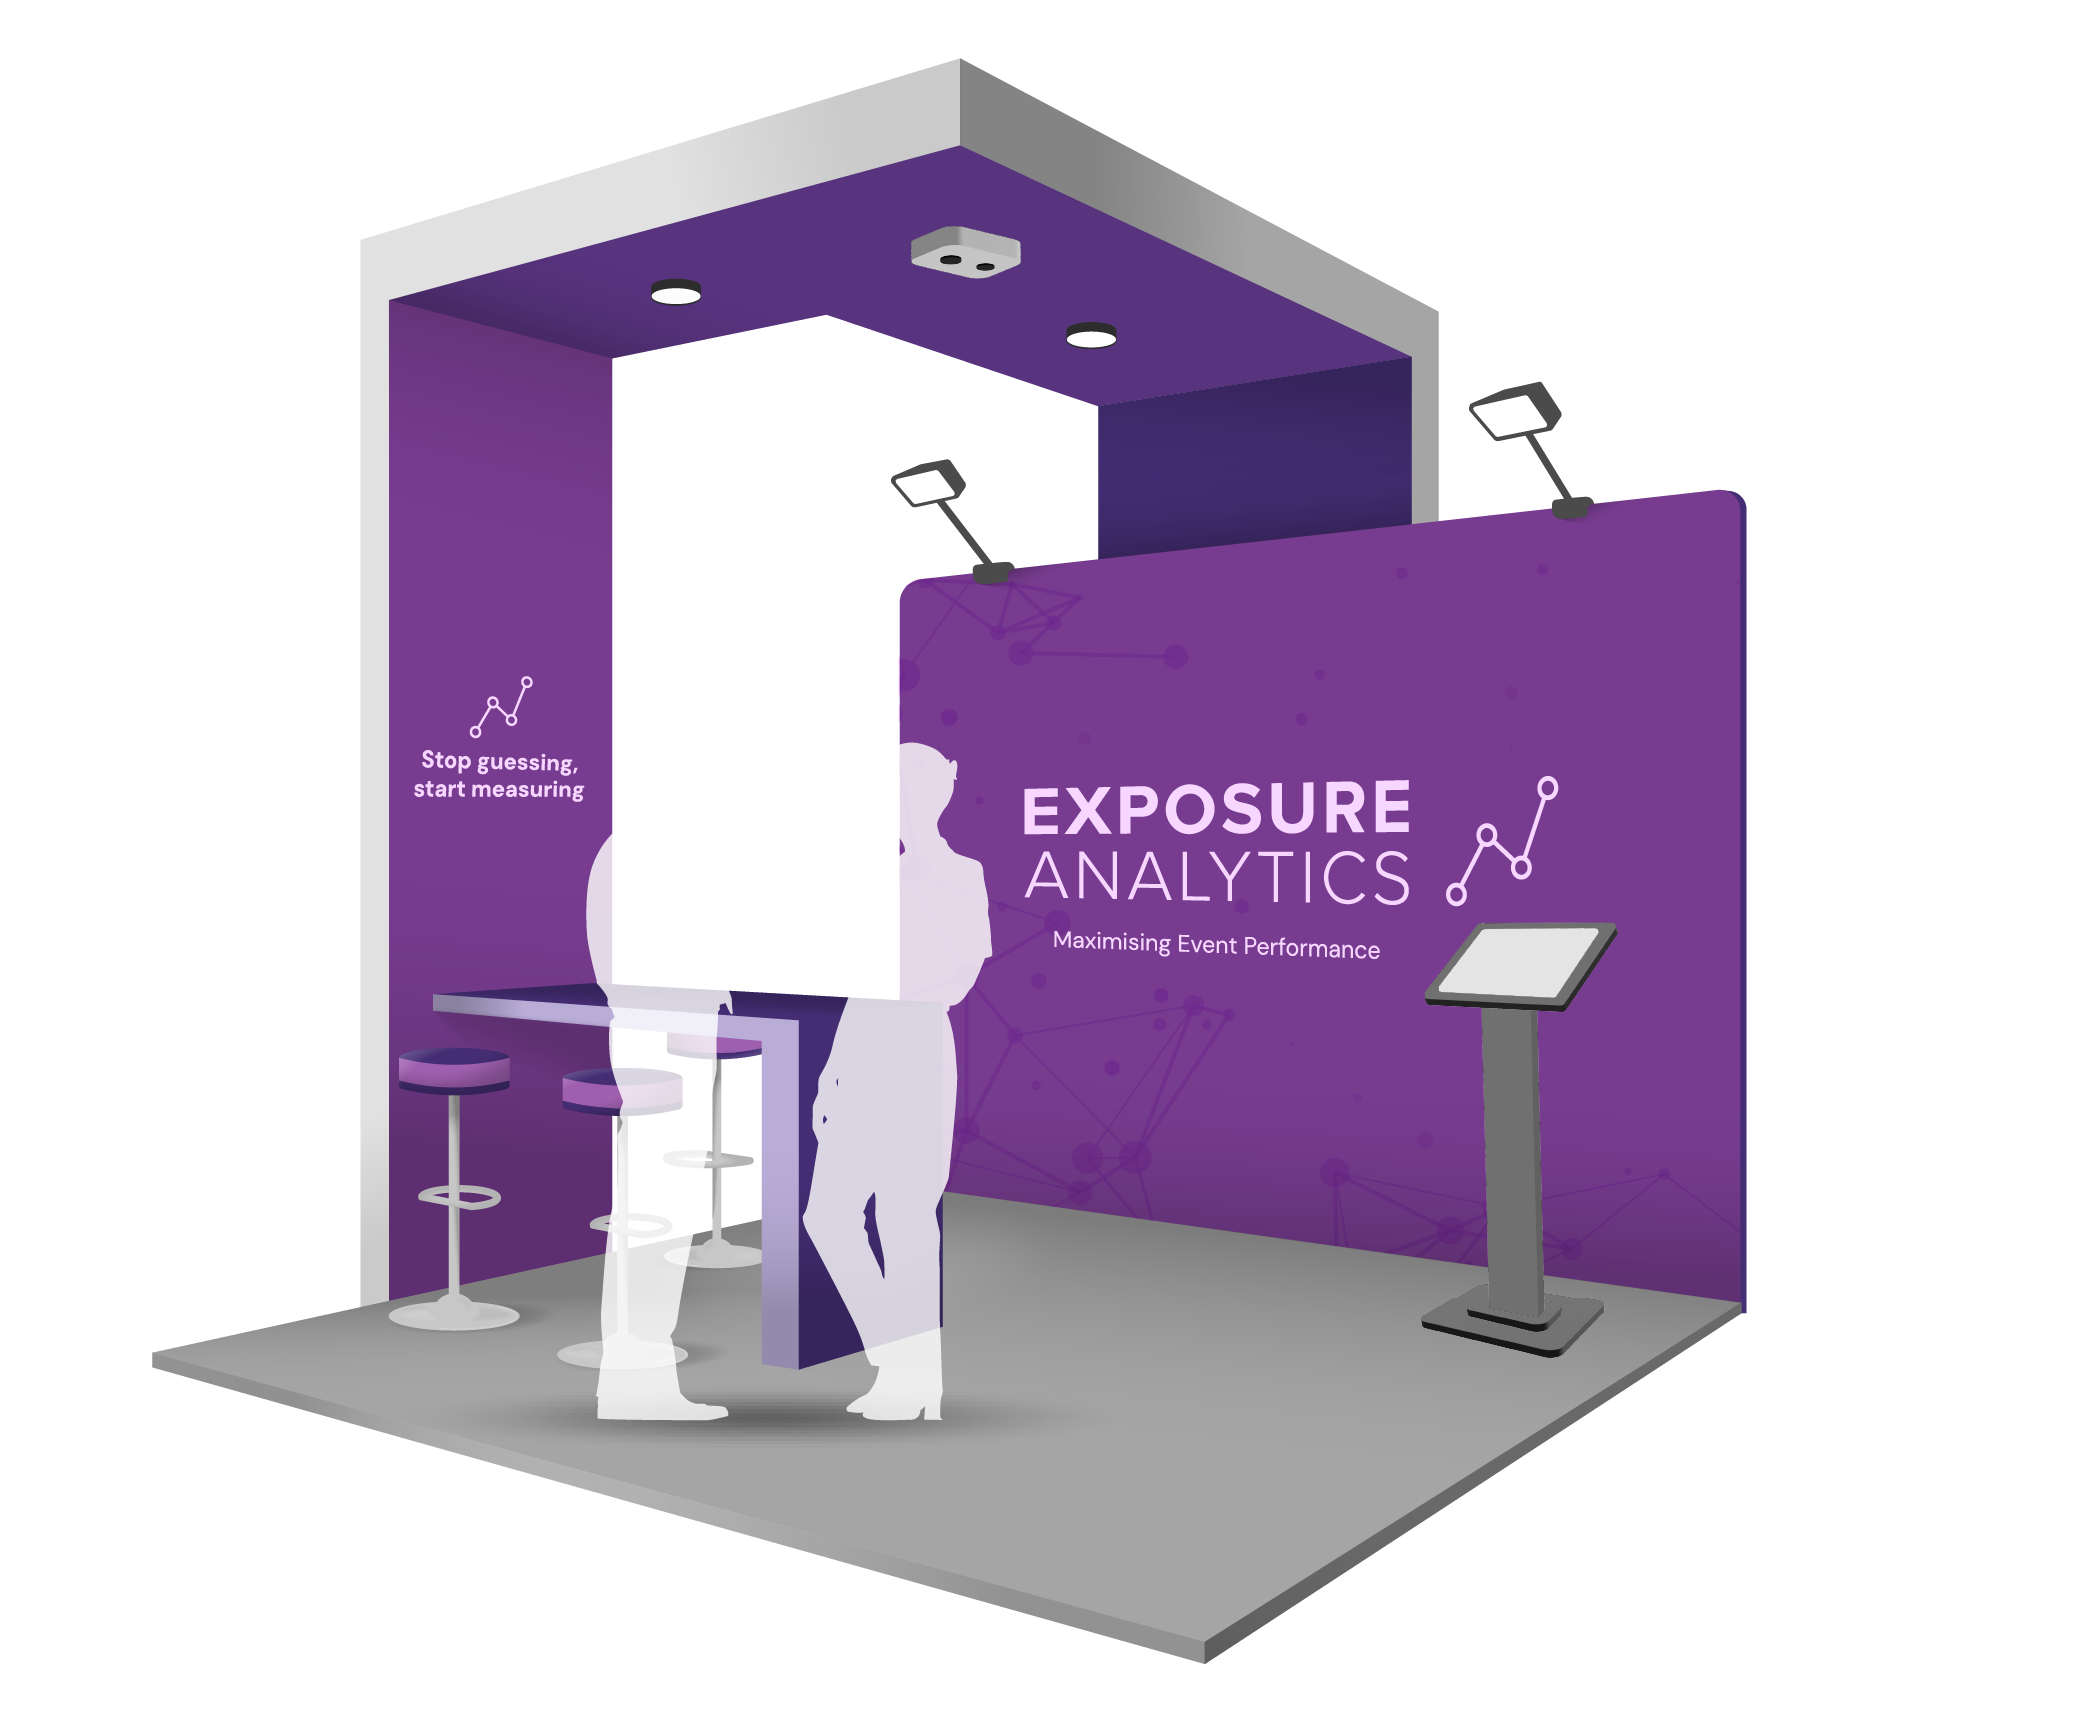
Measure impact, maximise experiences
Exposure Analytics is the market leader in analytics for events & public spaces
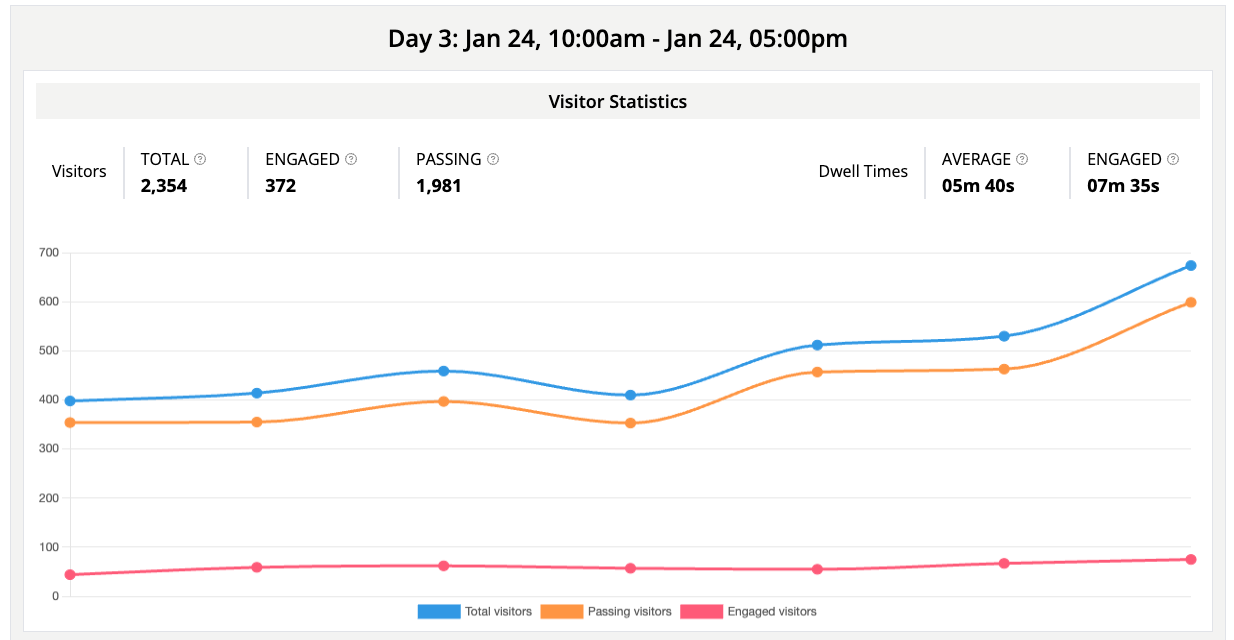
Exposure stats
Our statistics are pulled through from our live platform. Our sensors deliver real-time insights into how visitors interact with your event.


Insights we gather
When running an event, there are several considerations to make when measuring customer behaviour and footfall, including:


View the customer journey in real-time
- Do Visitors follow the route you want them to through design?
- Trace movements around your booth from most popular to least popular?
Are you getting the best dwell possible?
- What can you do to increase the dwell time?
- Does your booth encourage dippers or divers?
What areas are most engaging?
- Compare the engagement across areas on your booth
- Are people spending time where you hope they will?
Are your preconceived perceptions correct?
- What is working and what is not?
- Are your activations pulling people in?
Insights dashboard
The go-to event engagement Dashboard: Everything you need, one place.

Competitor Benchmarking
No more guesswork. Get accurate Competitor Benchmarking insights for your sector. Our Booth Scoring delivers hard data on competitor performance.

KPI's
With our solutions, you can fine-tune your approach and ensure your event is driving the desired outcomes.

-

Assess the impact of marketing initiatives
Events and exhibitions are great platforms for marketing a product launch, but how can you ever know if your marketing efforts have paid off without knowing how many eyes have seen the product itself?
-
Improve event layout and ease customer navigation
The foundation of a successful event is how well visitors find their way around it. Event analytics tools can show you the customers’ journey throughout the day in real-time, highlighting how people navigate as well as any potential pain points.
-
Understand the effectiveness of your investment
As well as using data to highlight your events’ most successful products, event analytics can help you compare, adjust, realign, and improve to make sure your investment is going in the right places.
-
Make confident decisions at a moment’s notice
Being as dynamic as they are, it’s important to always have a finger on the pulse of your event or exhibition. Make sure any last-minute or spontaneous changes to your event are informed by simple, clear data.
-
Tailor staff schedules
Know where to delegate staff throughout the day so you can always keep up with the shifting demands of foot traffic.

Our team have experience delivering our services globally.

Questions? We're here to help
Ready to see how Exposure Analytics can elevate your event and visitor insights? Get in touch with our team to explore how our powerful data tools can transform your event performance.