Home2024-08-06T17:02:23+01:00
PC

People Coordinates

People Coordinates gives you the next level in footfall analytics. See the precise movements of visitors and how the interact with your space.

Main slide

Stop guessing, start measuring

Exposure Analytics is the market leader in analytics for events & public spaces
previous arrow
next arrow

Our team have experience delivering our services globally.

From measuring the movement of thousands to capturing the engagement of each person who visits your event, Exposure Analytics provides you with all the data you need to measure the impact of your event.
Over the past eight years we’ve worked on over 5000 events around the world. Our sensors deliver real-time insights into how visitors interact with your event.

Olympia London

eForce is Olympia London’s commercial IT arm. The prestigious venue hosts large-scale exhibitions, conferences and product launches.

What we do

Do you have any questions? Contact us!

How we achieve this

Apex

Apex counts individuals in a defined space and monitors exit and entry points.

EX Sensor

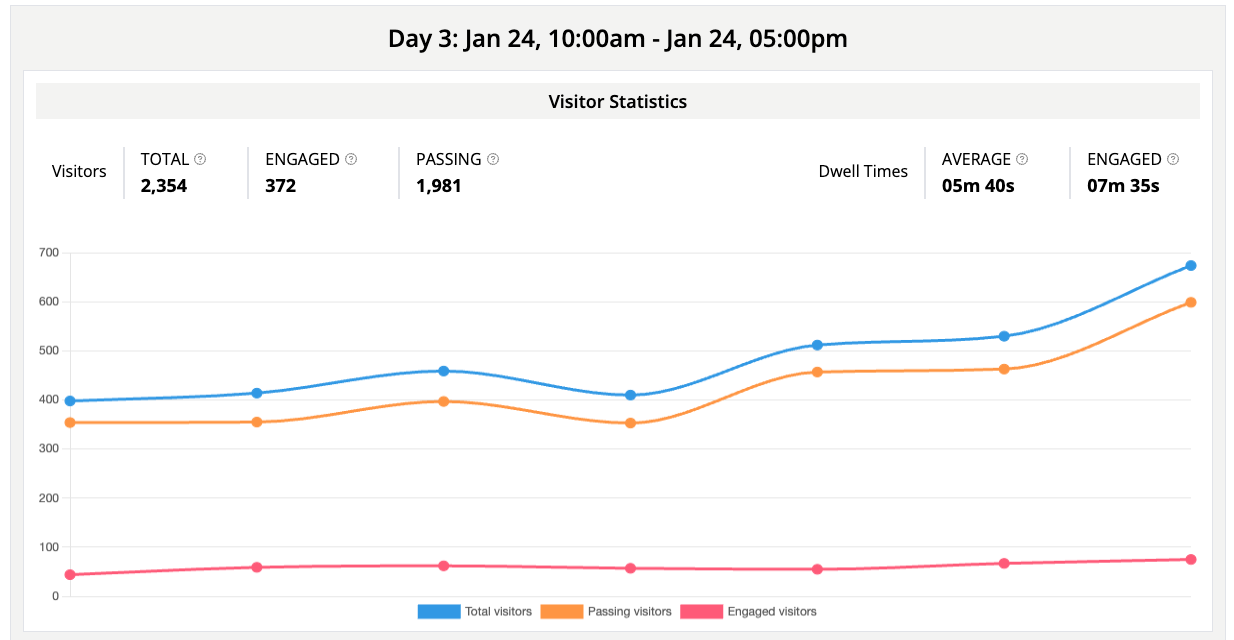
EX sensors give footfall, engagement rates, dwell times, and flow information for events and exhibitions.

People Coordinates

People Coordinates gives you the next level in footfall analytics. See the precise movements of visitors and how they interact with your space.

World-Leading Footfall Analytics Tools for Exhibitions And Events 

Since 2014, we’ve been helping to capture vital footfall data at over 6,000 global events. Thanks to our commitment to innovation and range of market-leading event analytics tools, we’re proud to have won a number of prestigious awards – such as ‘Best Use of Wireless Technology’.

If you’re looking for real-time insights into how visitors interact with your event, then both our wifi and lens-based sensors do precisely that. By using passive measurement systems to avoid storing user-identifying data, we can help pinpoint valuable insights for world-renowned companies, including global and Fortune 500 companies.

Ready to gain real-time visitor analytics for your event or exhibition? Get in touch with our analytics experts today and book a demo!


What Is Event Analytics?

Event analytics is a way of determining the number of customers entering your event throughout the day.

On top of this, event analytics also encompasses customer “journeys” in a designated space. This helps you understand how long people are spending at key touch points of your space and how effective engagement pieces are, so you know that you’re investing in the right places.

Maximising Event Performance with Footfall Analysis

To maximise the performance and profit of your live event, it is vital to measure and analyse your footfall. Also known as people counting or people tracking, footfall analysis measures the number of people passing through a designated area at a specific time.

Footfall analysis is a key performance indicator (KPI) for businesses that rely heavily on customer visits during events. It is an important indicator of how successful you are at bringing in visitors, allowing you to capture the flow of visitors and their buying behaviour.

With footfall analysis, you can better understand:

  • What drives engagement
  • The effectiveness of exhibition strategies
  • Best and worst-performing hours/days
  • Customer occupancy and how the layout of your stands affects performance

Using this data, you can effectively monitor visitor traffic and identify footfall trends and peak periods.

When running an event, there are several considerations to make when measuring customer behaviour and footfall, including:
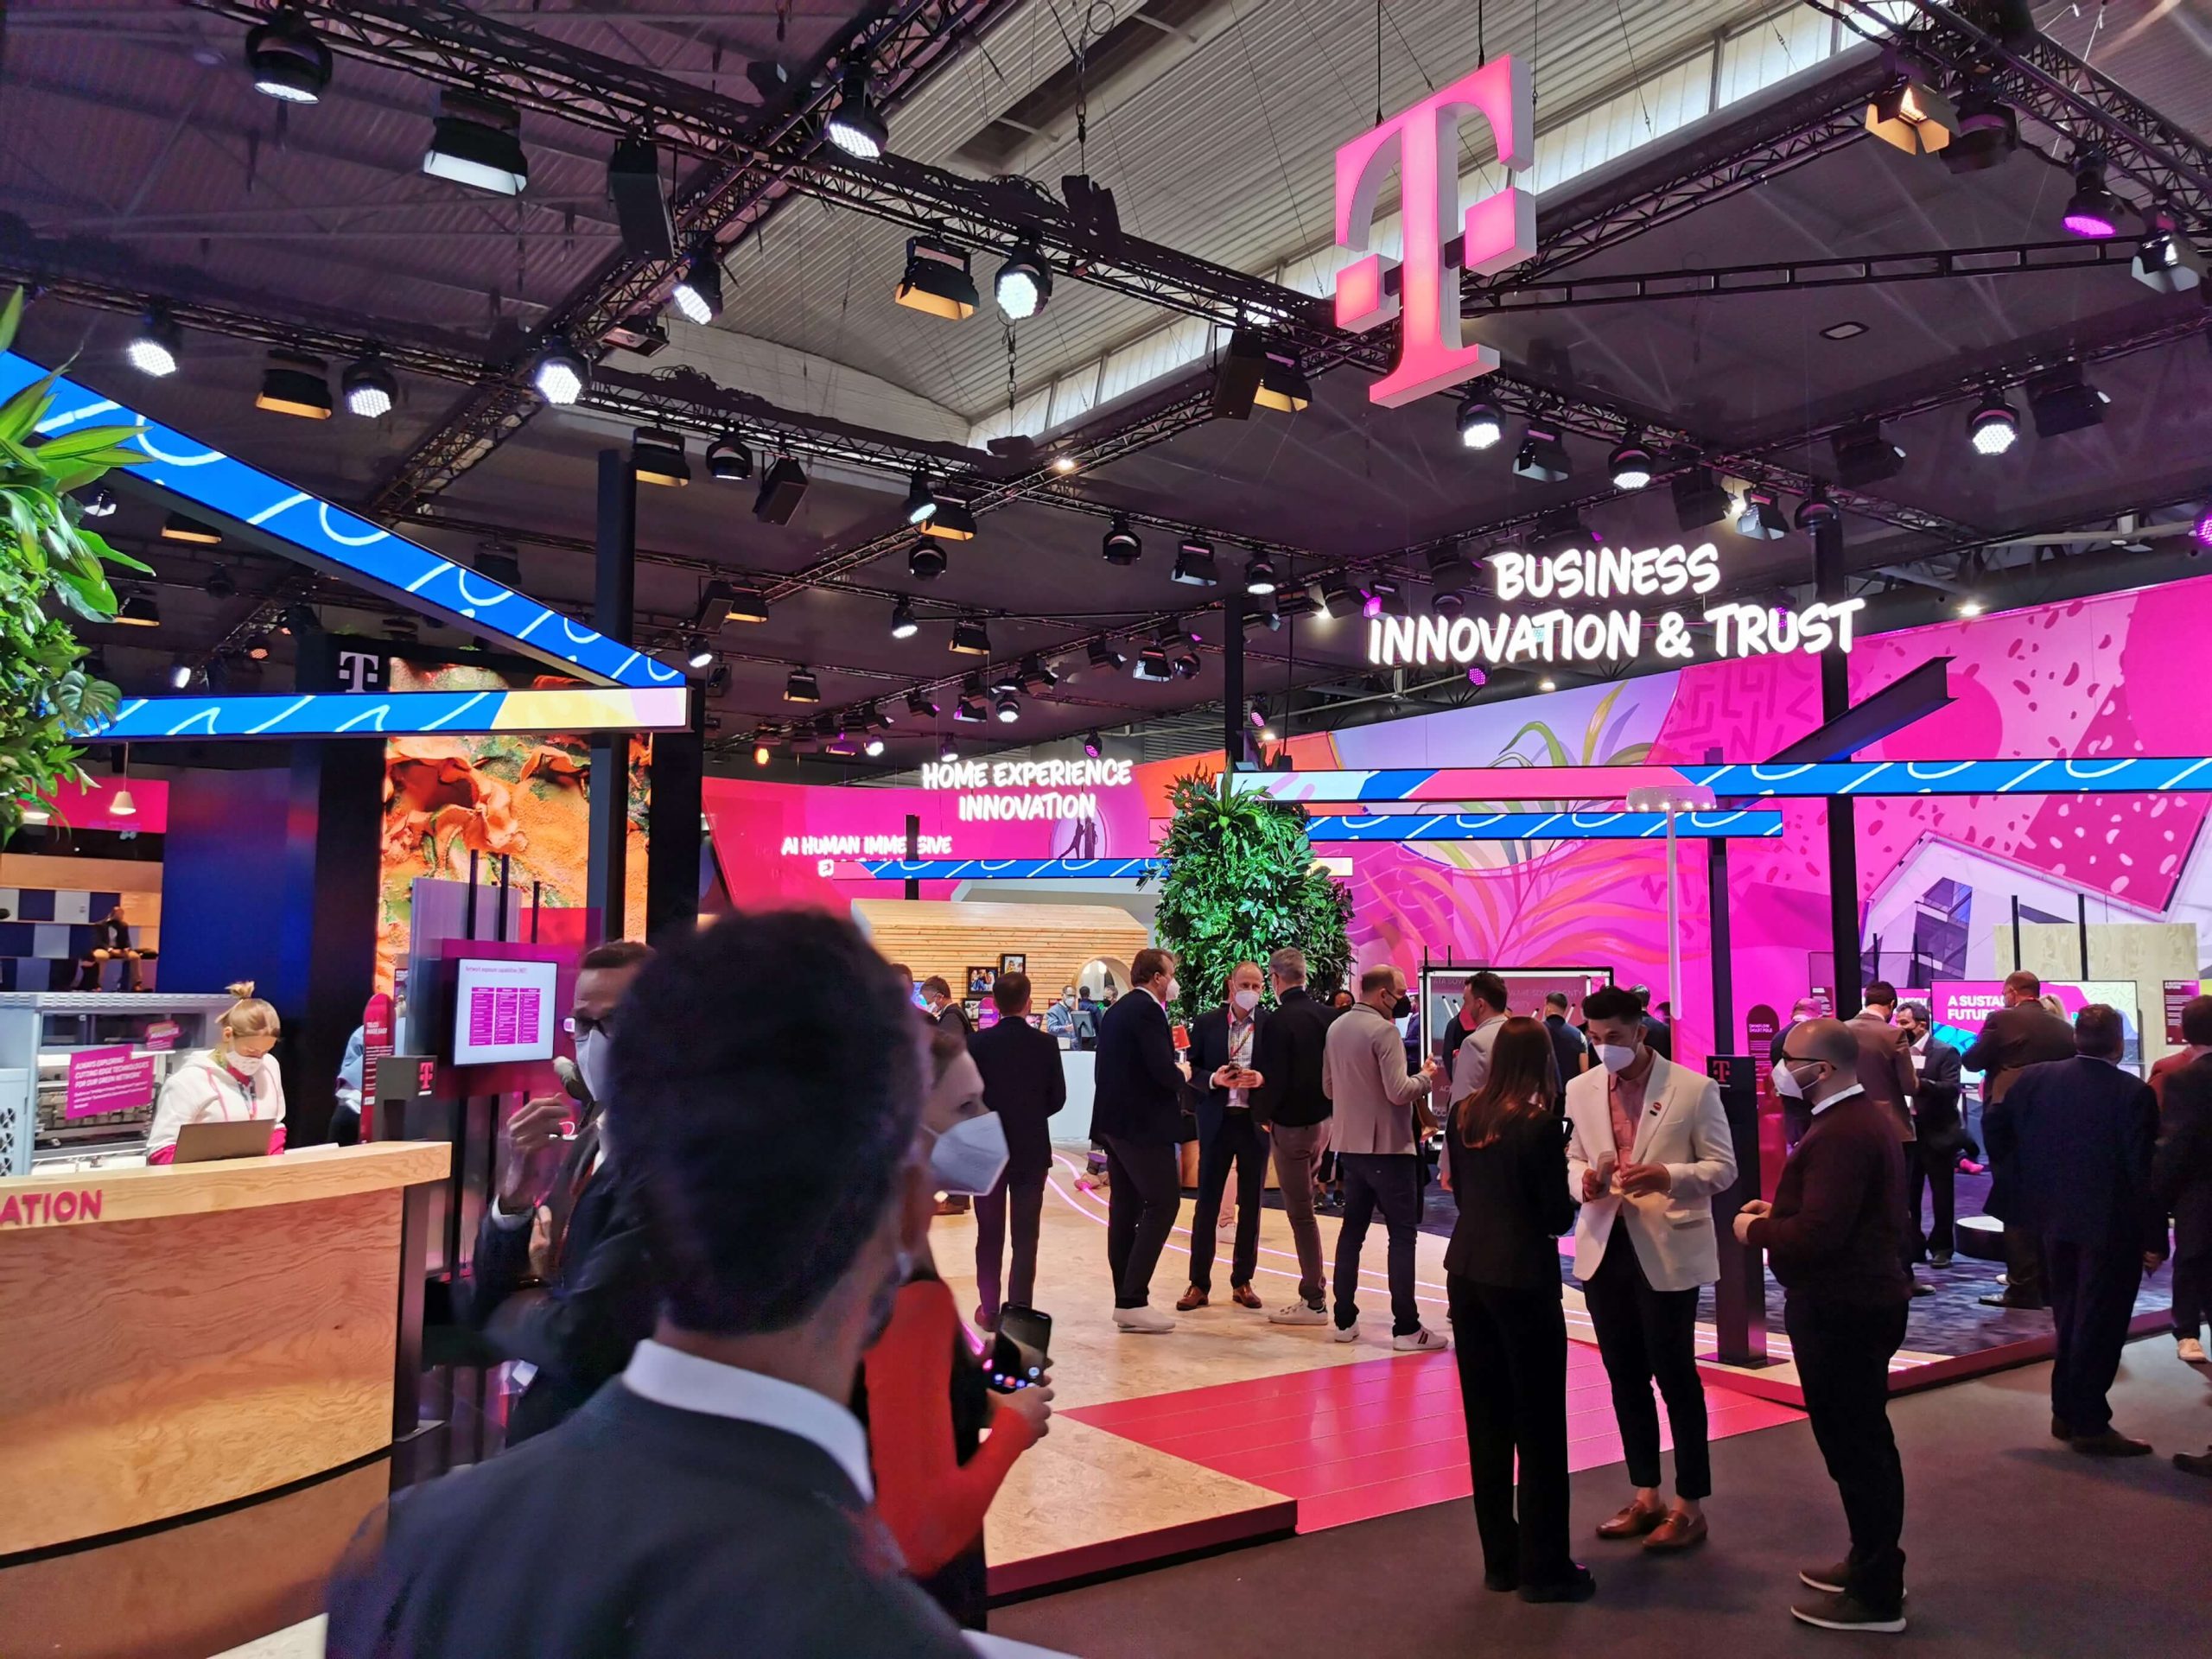
  • The number of people entering and exiting the event – How many customers enter and stay for an extended amount of time? Do customers dip in and out throughout the day?

  • Unique vs repeat visitors – How many of your customers come back after a day? Are they incentivised to return for days in a row? Do different days bring new visitors?

  • Popular zones – Which parts of your event space are attracting the biggest number of customers? Are these zones highly promoted compared to others? Do they attract large swathes of customers at once or smaller, more consistent streams throughout the day?
  • Time spent in queues – Do your visitors have to spend a lot of time in queues before enjoying some of your event’s stands? Can the space be adjusted to reduce queue times?

  • Average time spent at your event – How long do people spend at your event? Does it capture the interest of your customers long enough for them to check out all of your products?

Why Should I Count My Footfall?

Calculating footfall is a key metric for event organisers wanting to increase sales and drive profits up. By counting footfall, you can identify how many purchasing opportunities you have for your event or exhibition.

Knowing this information on an hourly, daily, and weekly basis can then give you an extra edge to target peak hours, convert visitors into customers, and optimise your event’s performance now and in the future.

Why Customers Choose Our Event Analytics

Our event analytics technology offers businesses over 95% accuracy in measuring their event’s impact.

Our sensors are easy to install and gather unique metrics about the movement, engagement, and dwell time of visitors. Combined, these metrics allow you to better assess if your exhibition has been a success based on your visitors’ traffic patterns and interactions.

With this information, you can more easily understand the most popular areas of your exhibitions and make more informed decisions about the prime placement of products for future events. By doing so, your event provides the best experience for your customers and improves profitability as a result.

Our technology can be used for events big and small. So far, we have successfully measured events with up to 200,000 simultaneous attendees.

A Consultative, Hands-On Approach to Your Event Analytics

Where some companies will leave you to your own devices, once the installation is complete, our team of event analytics experts stay on hand to help. We take the time to understand your precise targets so that our tools can be best applied to optimise your business’s profitability.

We will advise you on the series of metrics available, such as average visitor time, queue time, repeat visitors, etc. Based on this data, we then figure out which sensors are best for you as well as the optimal places for max footfall and visitor engagement.

Using the Exposure Analytics dashboard, you can gain a clear picture and see at a glance how your event or display is winning and losing visitor attention.

Major brands use our sensor technology to iron out any issues. It provides an effective, data-driven way to report on the success of current events and improve future ones.

Our Event Tracking Tools Are GDPR Compliant

Here at Exposure Analytics, we take privacy seriously and are compliant with GDPR and The Data Protection Act 2018 regulations.

A statement from The Information Commissioner’s Office (ICO) says that ‘If the data is anonymised and is unable to be re-identified it is not subject to the requirements of the GDPR and Data Protection Act 2018 (DPA).’

We implement privacy by design – we will never share anonymised MAC address data with third parties or create features that involve using data gathered to single out an individual.

We perform one-way encryption and truncate the MAC address to completely de-personalise it. It can’t then be linked back to an individual.

Our sensors are not intended to track singled-out individuals but instead garner insight into the numbers and movements of groups of people.

Does this sound like something you could use for your event or exhibition? Get in touch with our analytics experts today for a demo!

Apex

Our Apex lens-based sensors help you count the number of people within an event space through the monitored entry and exit points. With the help of ultra-wide viewing angles, Apex sensors cover large areas of event space with just a single sensor.

Define your own perimeters by physically drawing the area you want to be monitored. From there, this robust people-counting technology accurately tracks and identifies unique visitors within that given space.

EX Sensors

Using Wi-Fi signals from user devices, the EX Sensor captures a variety of vital visitor metrics to gain crucial insight into your event:

  • Footfall – Where your visitors are heading to the most. Understand if they are attracted to certain stands more than others and whether this changes throughout the day.
  • Dwell times – Which products are keeping your visitors around the longest? Get an accurate idea of your stands’ sticking power at different spaces within your exhibition.
  • Flow routes – How are visitors moving through your exhibition? Where do they go in order to get from product to product? Are there notable spots where traffic jams occur? Streamline your event’s space for ultimate user experience and optimal conversion.

Most visitors to your event will bring their smartphones with them. If Wi-Fi is enabled on them, these devices will emit ‘pings’ to search for available connections.

Our EX Sensors detect these pings and use them to track customer movement and interaction around the event. They also allow you to measure unique and repeat visitors as they come and go.

EX Sensor

Our EX sensors give footfall, engagement rates, dwell times, and flow information for events and exhibitions. Use insights from the captured data to help justify your expenditure, secure future budgets and improve your Return On Marketing Investment.

People Coordinates

People Coordinates works by getting down to the very granular. By this, you can gain an accurate insight into individual visitor movements and understand more clearly how specific interactions in key areas result in certain engagements.

Using People Coordinates, you can analyse the use of your space to ensure you get the most out of it and make the necessary adjustments.

Dashboard

When it comes to the performance of your stand or display, data is absolutely key. The Exposure Analytics dashboard allows you to visualise this data at any given moment and understand exactly where your investment is best placed.

Our cloud-based, mobile-responsive dashboard presents your event metrics in a digestible, user-friendly way, giving you an accurate picture of how your event is going at a glance.

Are you running more than one event? Compare performance between a series of events to understand what factors are ensuring success. Export your analytics into an easy-to-read PDF or spreadsheet to conduct deeper analysis.

Dashboard

Log in from anywhere to access real-time insights in our easy to understand dashboard. Footfall, engagement, dwell time, heat maps and flow routes are easily accessible on the day and for post-event evaluation. Compare and contrast multiple events and the touch of a button.

Why Customers Choose Our Event Analytics

The benefits of event analytics tools are vast. With the means to track precisely how customers are engaging with your exhibition, organisers can better curate future events, maximising potential sales opportunities.

With event analytics tools, you gain significantly higher insight into your events via real-time data. By knowing how many people are attending and where exactly they’re going throughout the day, you know which products are most popular so you can plan accordingly.

Build a detailed and accurate picture of your event traffic on an hourly or daily basis. This will help you improve your operational and strategic decisions and – most importantly – transform casual visitors into loyal customers.

What are some other benefits of utilising event analytics tools to track events?

Assess the impact of marketing initiatives

Events and exhibitions are great platforms for marketing a product launch, but how can you ever know if your marketing efforts have paid off without knowing how many eyes have seen the product itself?

Tools like Apex and the EX Sensor can tell you with clear visual data whether your marketing efforts have been a success, how to adjust in the future, and maximise return on marketing investment (ROMI).

Improve event layout and ease customer navigation

The foundation of a successful event is how well visitors find their way around it. Event analytics tools can show you the customers’ journey throughout the day in real-time, highlighting how people navigate as well as any potential pain points.

Understand the effectiveness of your investment

As well as using data to highlight your events’ most successful products, event analytics can help you compare, adjust, realign, and improve to make sure your investment is going in the right places.

Make confident decisions at a moment’s notice

Being as dynamic as they are, it’s important to always have a finger on the pulse of your event or exhibition. Make sure any last-minute or spontaneous changes to your event are informed by simple, clear data.

Tailor staff schedules

Know where to delegate staff throughout the day so you can always keep up with the shifting demands of foot traffic.

Think your event or exhibition would benefit from this live-tracking data? Get in touch with our analytics experts today!

How Do Event Analytics Tools Work?

Gone are the days of people standing by the door with a ticker in hand counting everyone that comes in and out of events. Not only is this a waste of resources, but it’s also highly susceptible to human error.

Footfall-counting tools are a key event analytics tool that removes the hassle of this arduous manual task.

Real-time footfall trackers use lens-based sensors to automatically monitor the number of people who pass a given threshold point – often an entry/exit point to a space. Whilst there are different tools providing different uses, they all provide continuous operation and accuracy.

Whilst some tools like the EX Sensor rely on Wi-Fi-enabled smartphones to understand customer traffic, beacon-based sensors stationed at specific areas account for traffic based on detecting visitor movement.

How Accurate Are Exposure Analytics Tools?

Whilst it isn’t possible to provide 100% accurate data due to significant variables in an event scenario, our goal is to provide a ‘pattern of movement’ with a target accuracy of 95%.

What Type of Internet Connection Do Footfall Sensors Need?

Where possible, we always recommend using hard-wired internet access for maximum accuracy.
If this is not possible, however, we provide sensors with inbuilt 4G connectivity to ensure that the sensors stay connected to your event space and provide an accurate picture of your foot traffic.

Do Our Footfall Devices Require Electrical Expertise to Install?

They do not require electrical expertise – the installation of our discreet footfall devices is straightforward and simple. They can be powered via ethernet, mains power, or even with a battery pack during shorter periods.

How Can Our Footfall Analytics Help Your Live and Experiential Events?

Accurately predict staffing needs

By understanding trends in traffic volume, you can plan staff schedules to more accurately meet demand. Expecting a drop in customer numbers? Spread tasks out to other parts of the event during quiet time so everything runs more smoothly during busier periods.

Convert more customers

Our Wi-Fi-enabled EX Sensors monitor the dwell time and engagement rate of your event’s stands to help you understand which factors impact potential conversion and abandonment rates. How long are customers staying at a stand?

Are they engaged from the outset or do they ‘bounce’ within minutes? Use these granular details to adjust the customer experience from day to day and improve profitability.

Reduce congestion

Identify areas of congestion and understand how changes to staffing, layout and other factors improve the flow of traffic. By doing this, you give your customers the best experience by providing them with optimal space to walk and look around.

Our Event Analytics Tools in Action

Throughout the years, our analytics tools have allowed large-scale events to better understand their customer footfall, where their most popular areas of traffic were, and how they could plan ahead in the future.


Case Study: Made in America Festival

In 2015, TOURtech came to us to help capture and analyse the movement of festival goers at the Budweiser Made in America Festival.

They were struggling to achieve accurate event figures for the festival, including how people moved around the site, how long they spent in certain areas, and which food and sponsor areas were the most popular.

Their sponsorship deal and food/merch sales were vital to the financial success of the Made in America event and so this footfall information was key to evaluating and planning follow-up live events. In the past, organisers had to rely on unreliable anecdotal reports and the general buzz of a space.

We put an end to that uncertainty. Our EX Sensors allowed us to accurately pinpoint the movements of any users that attended the event with a smartphone (up to 90% of attendees). From there, we could track exactly which zones were most popular and how long visitors spent there.

By the end of the festival, TOURtech had extensive access to event data to take away with them for future live and experiential events. Want to see the results? Check out the case study from Made in America backed up by our in-depth graphs and heat maps.

Case Study: Olympia eForce

eForce came to us with the goal of making Olympia London the first-choice venue for organisers. To assist eForce with this goal, we used our expertise to develop a next-level analytics tool to help them build an accurate picture of engagement with their stands.

So, what did they find?

With the help of our product, we revealed crucial info such as the hotspots around catering outlets and the dwell times at each stand.

eForce was also able to compare data between days, helping them understand how the fourth day of an event was notably more poorly attended than the rest. This clear data on visitor numbers was invaluable in advising them in their future planning.

‘From conversations with venues and organisers who have tried other analytics products I know that there are some key advantages of Exposure Analytics.

‘You don’t need to be a data analyst to read the results. You can easily view the information you need and understand it. The results are also more detailed than some other venue-wide systems. Exposure Analytics allows you to be as granular as you like to really pinpoint what’s happening in the event space.’ – Amir Vered – eForce

Accurate Footfall Data in a Post-Pandemic World

Hospitality and retail sectors used modern footfall technology to count customer numbers for years before the Covid-19 pandemic. When the pandemic began in early 2020, businesses adopted technology to monitor customer footfall, minimise contact among them, and curb the spread of the virus.

As events have resumed post-Covid, restrictions on our movements in physical locations have eased. However, customer confidence in these brick-and-mortar outlets is unlikely to return to pre-pandemic levels for the foreseeable future, resulting in lower sales and profit.

Even though footfall analysis tools are now used less for public safety reasons, there is still a strong case for processing footfall data in a way that allows establishment owners to ensure long-term business continuity and customer satisfaction.

Take advantage of the latest in event analytics, skyrocket your event’s profitability, and offer the best customer experience possible. Get in touch with our analytics experts today!

Enhancing Exhibitions with Tracking Technology

August 30th, 2024|Exposure Analytics Blog|

In this blog, we will discuss the benefits that sensor and tracking technology can have on your event marketing strategy. This includes footfall analytics, people analytics and live data insights – all of which will be advantageous to your exhibitions and events now and in the future. Carry on reading to find out what tracking technology is, how it works, the components used to make it work and the [...]

The Power of Benchmarking at Events & Exhibitions

August 30th, 2024|Exposure Analytics Blog|

The power of competitive benchmarking at events and exhibitions ultimately boils down to the challenge of measuring success. There’s a lot going on already, you are concentrating on your exhibit, networking, being attentive and friendly with people. It can often be difficult to balance all that with monitoring your own success and coming up with improvements to your strategy. Competitive benchmarking is any form of strategic comparison with a [...]

Increasing Event ROI with Data Driven Insights

August 29th, 2024|Exposure Analytics Blog|

Data driven insights can help you navigate the challenges of measuring your event marketing return on investment (ROI). The main ordeal here is to accurately track and attribute the direct impact your live events have on your revenue, where results can be influenced by many different factors spread over time. Benefits such as brand awareness, networking, and customer relationships can be hard to quantify, which also complicates the calculation [...]

CONTACT EXPOSURE ANALYTICS

Want to get in touch? Drop us a line by using the contact form below or give us a call on 0203 982 0997