As an event technology company, Event Tech Live is a key event for Exposure Analytics each year. We’re keen to meet new clients, catch up with our current customers, and find out more about the latest developments in the industry.
The Challenge
We attend Event Tech Live annually; it’s the only trade show we take a stand at. This year we invested in a new stand, and were keen to be able to see what impact it had compared with last year. For the first time in 2018, Event Tech Live ran over two days instead of just one, so we were also curious about whether the new two-day format would make a difference to visitor numbers or interest levels. We wanted to know what the footfall was around our stand, how many people stopped to find out more, how did they feel about our stand, and how does this compare to previous years?
The Solution
To be able to assess how we did at Event Tech Live we put ourselves in the position of one of our clients. We used our own technology including Aperture cameras and also a brand new version of Exposure Analytics. We were able to capture a huge amount of data to help us to understand what had happened at the event and how we had performed. Recent improvements to our platform have meant that it’s even easier to compare events from year to year or venue to venue.
The Data
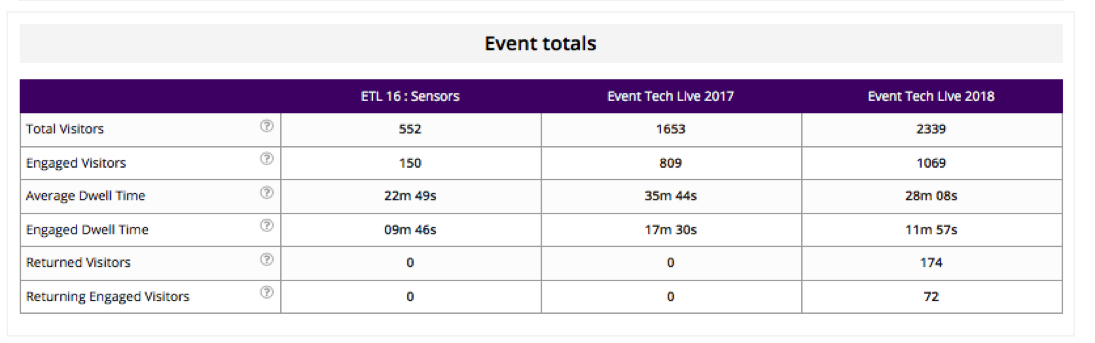
So what did the data tell us? From a simple overview of 2016, 2017, and 2018, it’s clear that the two-day Event Tech Live was a huge success. Visitor numbers were up, engaged visitors were up and although dwell time and engaged dwell time were slightly down from 2017 they still represent a marked increase on 2016.
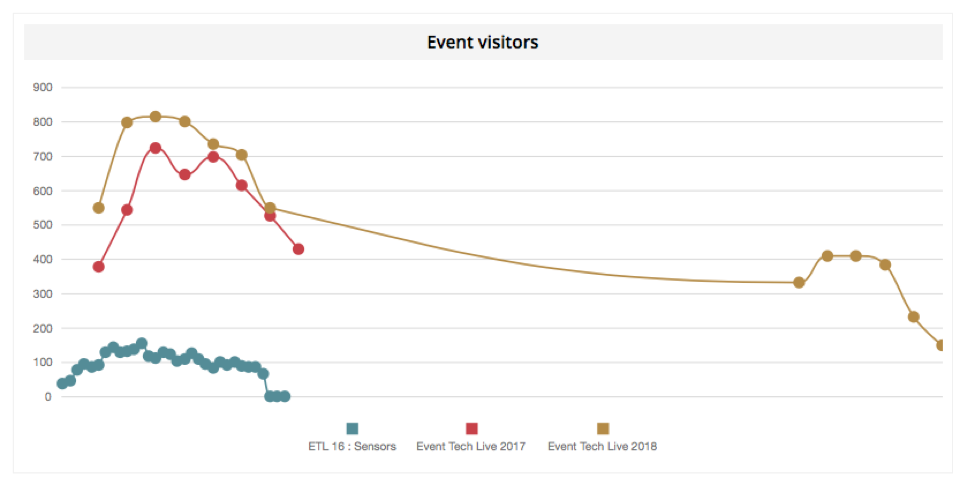
We can do a daily comparison of how those event visitors break down. We can see that Day One of the 2018 Event Tech Live was slightly ahead of 2017’s event. Although Day 2 was quieter there were still a good number of visitors, more than enough to make it worth our while being there.
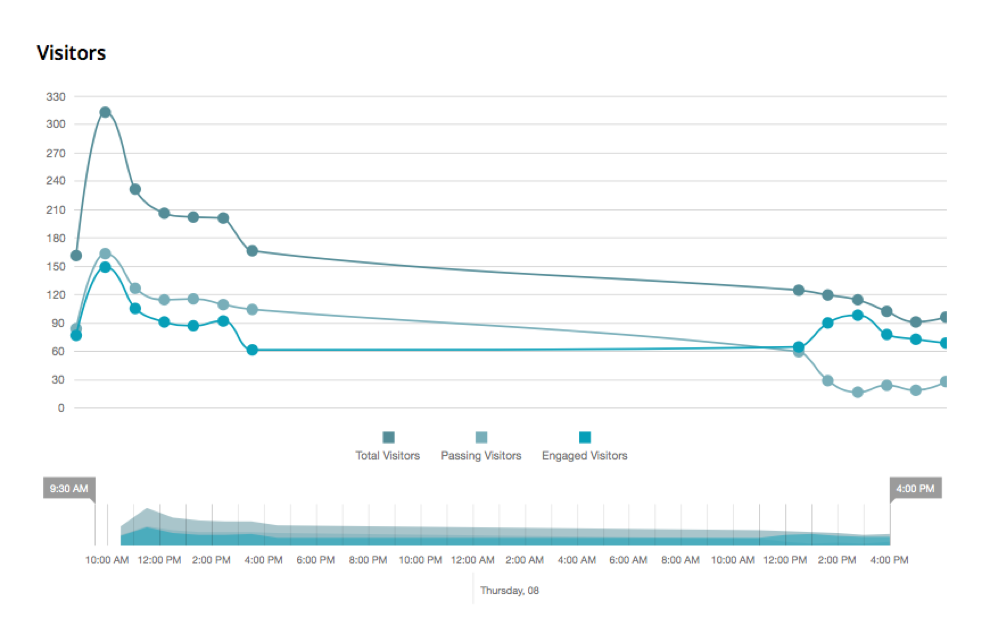
We can also see that mornings are the busiest time. This pattern is even clearer to see with a closer analysis of visitor numbers over the two days of Event Tech Live 2018. One of the many useful data sets that Exposure Analytics can give us is a breakdown hour-by-hour of how many visitors were around the stand. We can see the biggest spike early on day one. This can help us to plan when we have our staff on our stand and when we take breaks and spend time looking around the event.
Did we capture people’s attention?
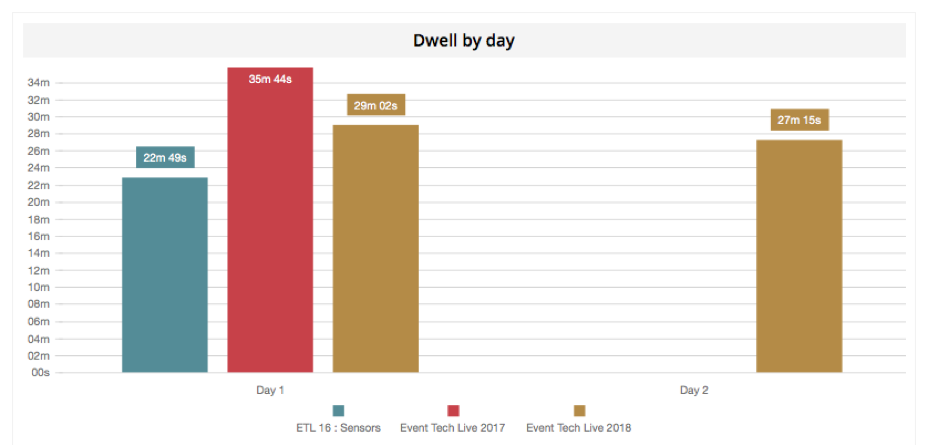
When we dig into the figures and look at the dwell time by day we can see that across 2017 and 2018 there’s a good dwell time for each of the days. Factoring in that 2018 had the highest number of visitors, if we calculate the total time we spent with engaged visitors on our stand, we have the data to back up our feeling that it was the best event yet.
The Results
It’s clear to see that the two-day Event Tech Live and our new stand were a real success. This is also backed up by get us getting a record number of leads from this year’s event. Combining the comprehensive sensor data, the number of leads, anecdotal feedback, and follow up sales, we have everything we need for a complete evaluation of the event. We’ll definitely be back in 2019.
The Future/Power to You/See Your Success
Based on the data, our experiences and the fact that we won two Awards this year, Event Tech Live will remain a firm fixture in our calendar. We can easily see that the cost of the stand is worthwhile in terms of the results we get across all areas of our measurements.
If you want to know whether your attendance at events is getting you the returns you want and how to compare and contrast different events or the same event year on year please get in touch to find out how we can help you to Stop Guessing and Start Measuring.